Extreme Weather #14 – Trends in Extreme Hot and Cold Days & Nights
Global temperature has been rising since around 1900, and CO2 is the principal cause. The physics behind the inappropriately-named “greenhouse effect” is certain, so burning fossil fuels, which adds CO2 to the atmosphere, is certain to increase the surface temperature. I’ve written many articles on that topic on the original blog and shown how the equations are derived (see Notes).
So it should be no surprise to find that there are more extreme hot days and less extreme cold days.
If the temperature goes up, then the number of days with a temperature above say 35°C (86°F) or 40°C (95°F) - or whatever number you want to pick - will increase.
Likewise, the number of days with a temperature below say -10°C (14°F) or -20°C (-4°F) - again, pick a number for your region - will decrease.
Here’s a graph of global land and ocean temperature, extracted from a larger graph in chapter 2 of AR6 (see the Notes below for the full map of changes):
For reference the average global temperature has increased about 1.1°C since 1900.
Here is the change since 1960 in the hottest days and coldest nights from chapter 11 of AR6:
We can see that the annual hottest temperature is up on average by about 1.5°C and the coldest night is up by about 3°C since 1960.
Now the map of regional changes, this time it is the trend per decade.
The summary in plain English (full text below in the Notes):
It’s virtually certain that extreme hot days have increased, and extreme cold days have decreased. There are more heatwaves. Annual minimum temperatures have increased about 3x more than annual maximum temperatures.
There’s nothing to disagree with here, and no suprises (but a little surprise when looking at the detailed maps below).
One positive note, the summary didn’t ignore or obscure the good news about extreme cold days.
I thought it would be interesting for some people to see some more detail so I dived into one of the references, Dunn et al 2020. In the Supplementary material they have an exhaustive set of graphs.
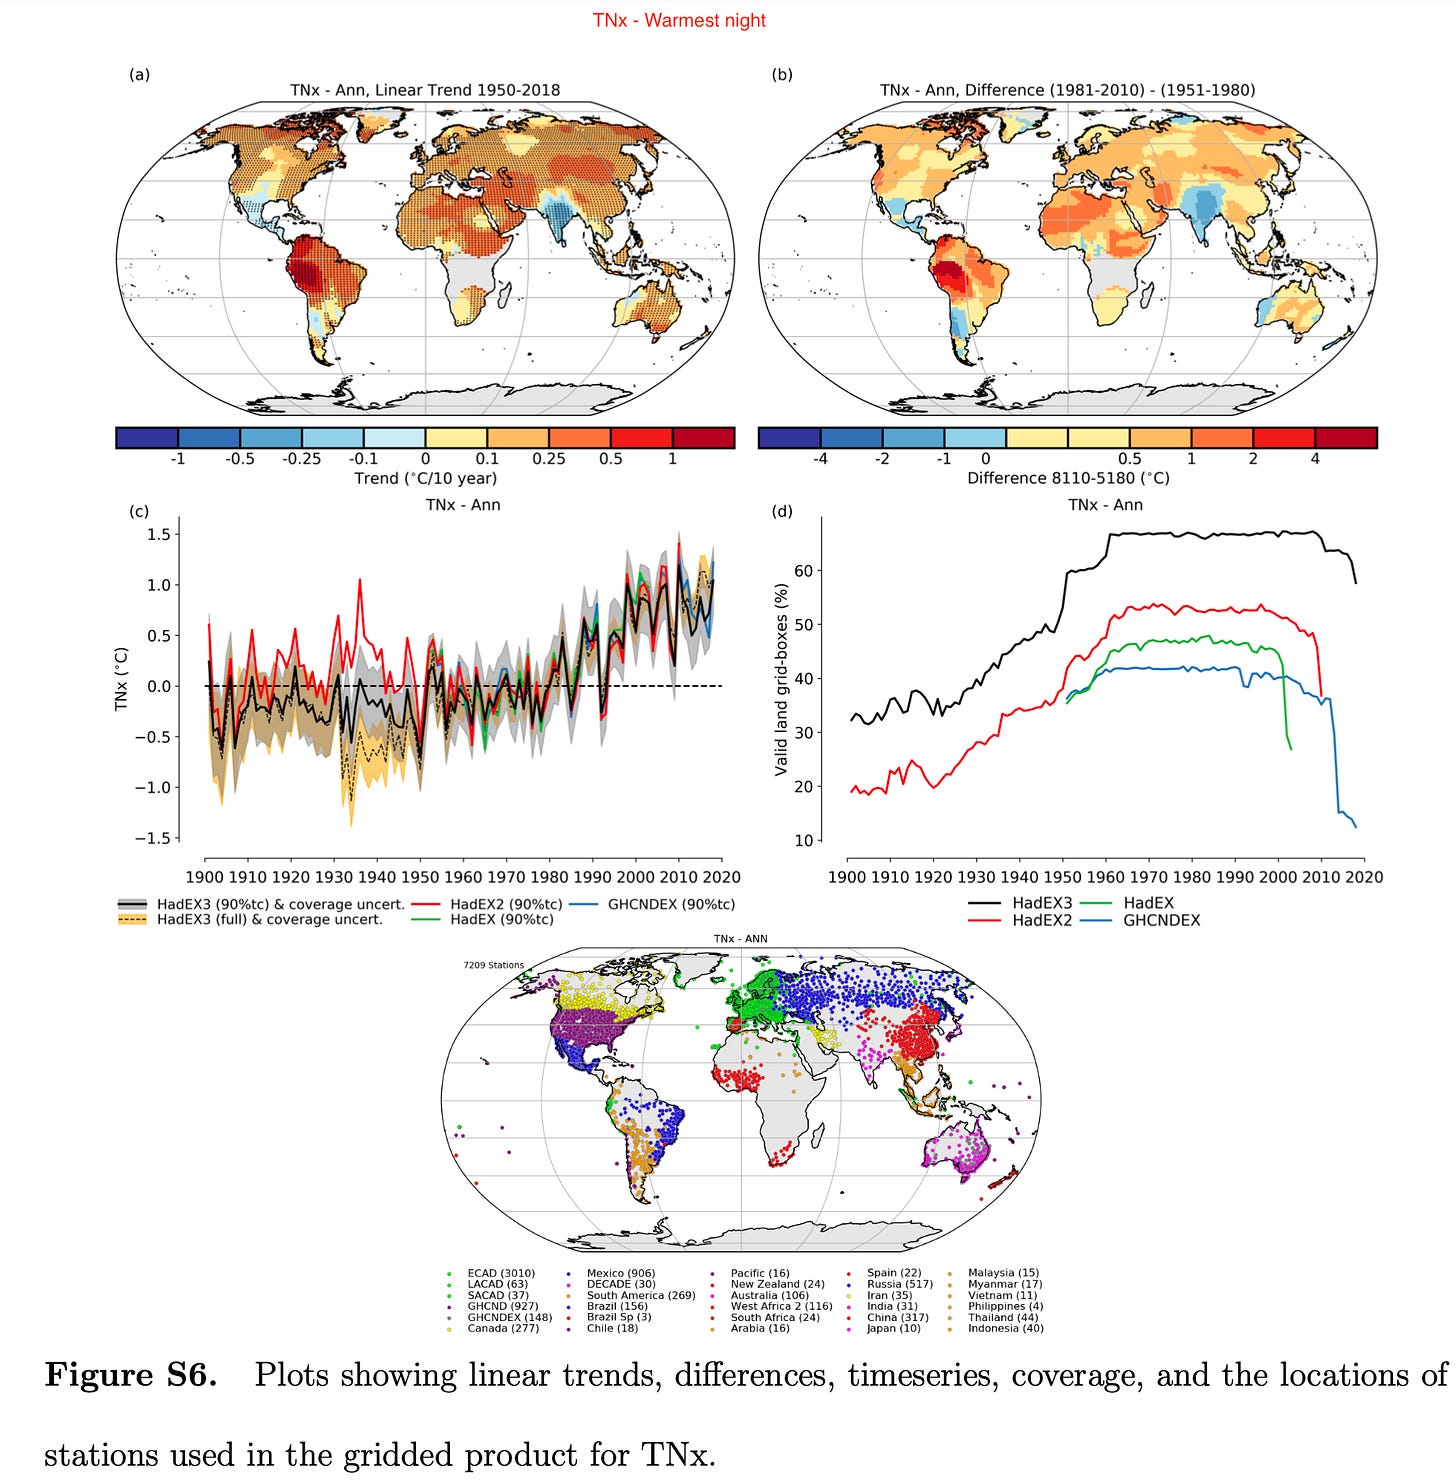
I was quite suprised to see the different trends of coldest day, coldest night, hottest day, hottest night. (In each case the red annotation at the top is mine, to keep track of the obscure notation).
Coldest Day - changes in lowest annual value:
Coldest night - changes in lowest annual value:
Hottest day - changes in highest annual value:
Hottest night - changes in highest annual value:
If we look at the annual maximum of the hot days, the increase seems to be about 1°C since 1900, and suprisingly the 1930s were around the same as recent temperatures.
However, there is clearly a lot more uncertainty about extremes the further back we go in time as we can see from the shaded area on the graph.
The hottest nights have increased in temperature more than the hottest days.
The coldest days are showing similar values around 1900 as today. The coldest nights are clearly showing a big increase.
Notes
For more about the “greenhouse effect”, see:
The graphic with maps from AR2, p.316 - “Changing State of the Climate System”:
The full text of the summary on extreme temperatures from p.1550:
In summary, it is virtually certain that there has been an increase in the number of warm days and nights and a decrease in the number of cold days and nights on the global scale since 1950. Both the coldest extremes and hottest extremes display increasing temperatures.
It is very likely that these changes have also occurred at the regional scale in Europe, Australasia, Asia, and North America. It is virtually certain that there has been increases in the intensity and duration of heatwaves and in the number of heatwave days at the global scale. These trends likely occur in Europe, Asia, and Australia. There is medium confidence in similar changes in temperature extremes in Africa and high confidence in South America; the lower confidence is due to reduced data availability and fewer studies.
Annual minimum temperatures on land have increased about three times more than global surface temperature since the 1960s, with particularly strong warming in the Arctic (high confidence).
References
Gulev, S.K., P.W. Thorne, J. Ahn, F.J. Dentener, C.M. Domingues, S. Gerland, D. Gong, D.S. Kaufman, H.C. Nnamchi, J. Quaas, J.A. Rivera, S. Sathyendranath, S.L. Smith, B. Trewin, K. von Schuckmann, and R.S. Vose, 2021: Changing State of the Climate System. In Climate Change 2021: The Physical Science Basis. Contribution of Working Group I to the Sixth Assessment Report of the Intergovernmental Panel on Climate Change
Seneviratne et al, 2021: Weather and Climate Extreme Events in a Changing Climate. In Climate Change 2021: The Physical Science Basis. Contribution of Working Group I to the Sixth Assessment Report of the Intergovernmental Panel on Climate Change
Development of an Updated Global Land In Situ‐Based Data Set of Temperature and Precipitation Extremes: HadEX3, Robert J. H. Dunn, Journal of Geophysical Research: Atmospheres (2020)


