


Extreme Weather #16 - Modeling Tropical Cyclones
One Look at the Effect of Higher Resolution Models

In #15 we looked at one issue in modeling tropical cyclones (TCs). Current climate models have actual biases in their simulation of ocean temperature. When we run simulations with and without these errors there are large changes in the total energy of TCs.
In this article we’ll look at another issue - model resolution. Because TCs are fast and small scale, climate models at current resolution struggle to model them.
It’s a well known problem in climate modeling, and not at all a surprise to anyone who understands the basics of mathematical modeling.
This is another paper referenced by the 6th Assessment Report (AR6): “Impact of Model Resolution on Tropical Cyclone Simulation Using the HighResMIP–PRIMAVERA Multimodel Ensemble”, by Malcolm Roberts and co-authors from 2020.
The key science questions addressed in this study are the following:
1) Are there robust impacts of higher resolution on explicit tropical cyclone simulation across the multi- model ensemble using different tracking algorithms?
2) What are the possible processes responsible for any changes with resolution?
3) How many ensemble members are needed to assess the skill in the interannual variability of tropical cyclones?
In plain English:
They review the results of a number of climate models each at their standard resolution and then at a higher resolution
When they find a difference, what is the physics responsible? What’s missing from the lower resolution model that “kicks in” with the higher resolution model?
How many runs of the same model with slightly different initial conditions are needed before we start to see the year to year variability that we see in reality?
Here’s a graphic which might look a little overwhelming, but I’ll explain the key points. This is my annotated version. Focus on the bottom right box and the top left box:

Bottom right is “Observations” or reality, as best as we can measure it. The two numbers in the centre of the donut are the number of TCs per year across a 35 year period. Top - 53.6 - is the number for the northern hemisphere (NH) and the bottom - 20.8 - is for the southern hemisphere (SH).
Now in the top left highlighted box we have two models. On the left is the usual (lower resolution) version of the model and on the right is a higher resolution version. We want to compare the models with reality and see if things improve as we go from low to high resolution.
The lower resolution version gets the number of NH TCs about right, but has three times the number of SH TCs. The higher resolution model calculates more storms but that makes it worse.
The “pie chart” shading indicates the share of TCs for each NH ocean basin. That seems pretty good.
Hopefully you’ve digested the first part of the graphic. Now if you look across the rest of the first row and the second row you see pairs of results - LR = low res (normal res) and HR = high res for each model.
I’ve reproduced it again without my highlights:
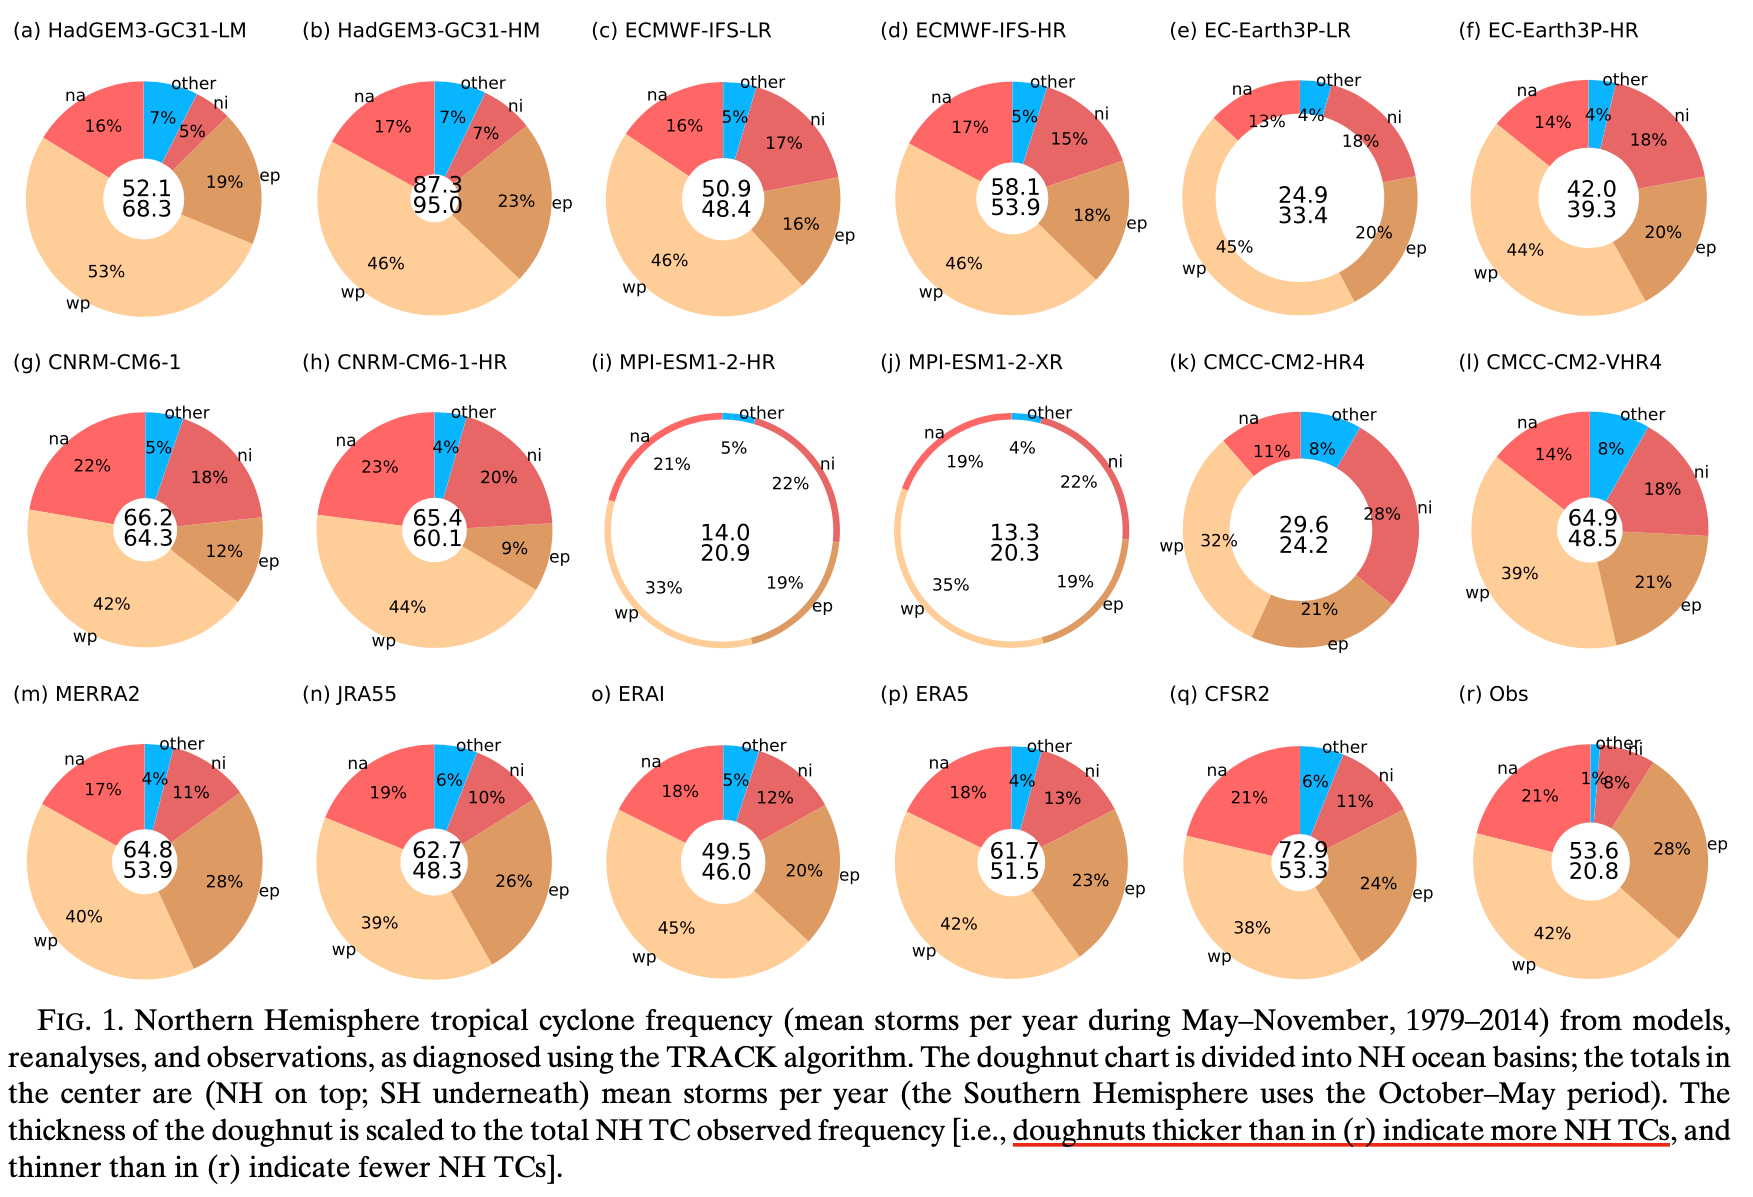
We can see that high res versions of the models produce more TCs in four out of the six models, but that isn’t necessarily a good thing.
Well, as climate modelers know, models often get things right for the wrong reasons.
We also see that the models differ wildly from each other in their attempted representation of reality.
There’s a further complexity with comparing models and reality, especially for dynamics like this - determining whether or not we have a TC occurring. So this paper does the same test again but this time using a different “tracker”:

Now we see that comparing models and reality sometimes comes with major challenges.
Great care is needed when interpreting absolute TC frequency from a single tracker, since this will depend on many factors, including the tracker criteria and analysis grid. Features such as the hemispheric asymmetry could lead to the conclusion that the models produce too many SH TCs, but at least in part this seems to depend on how such storms are initially characterized (by vorticity or sea level pressure); observational issues could also contribute to the difference between models and observations, for example because SH tropical depressions and subtropical cyclones are not included in best-track data whereas they are in the NH.
Here’s another important graphic from their paper. I’ve highlighted the bottom graph because it has “Observations” - the black line. Now we’re looking at maximum wind speeds because models struggle to reproduce more severe TCs:
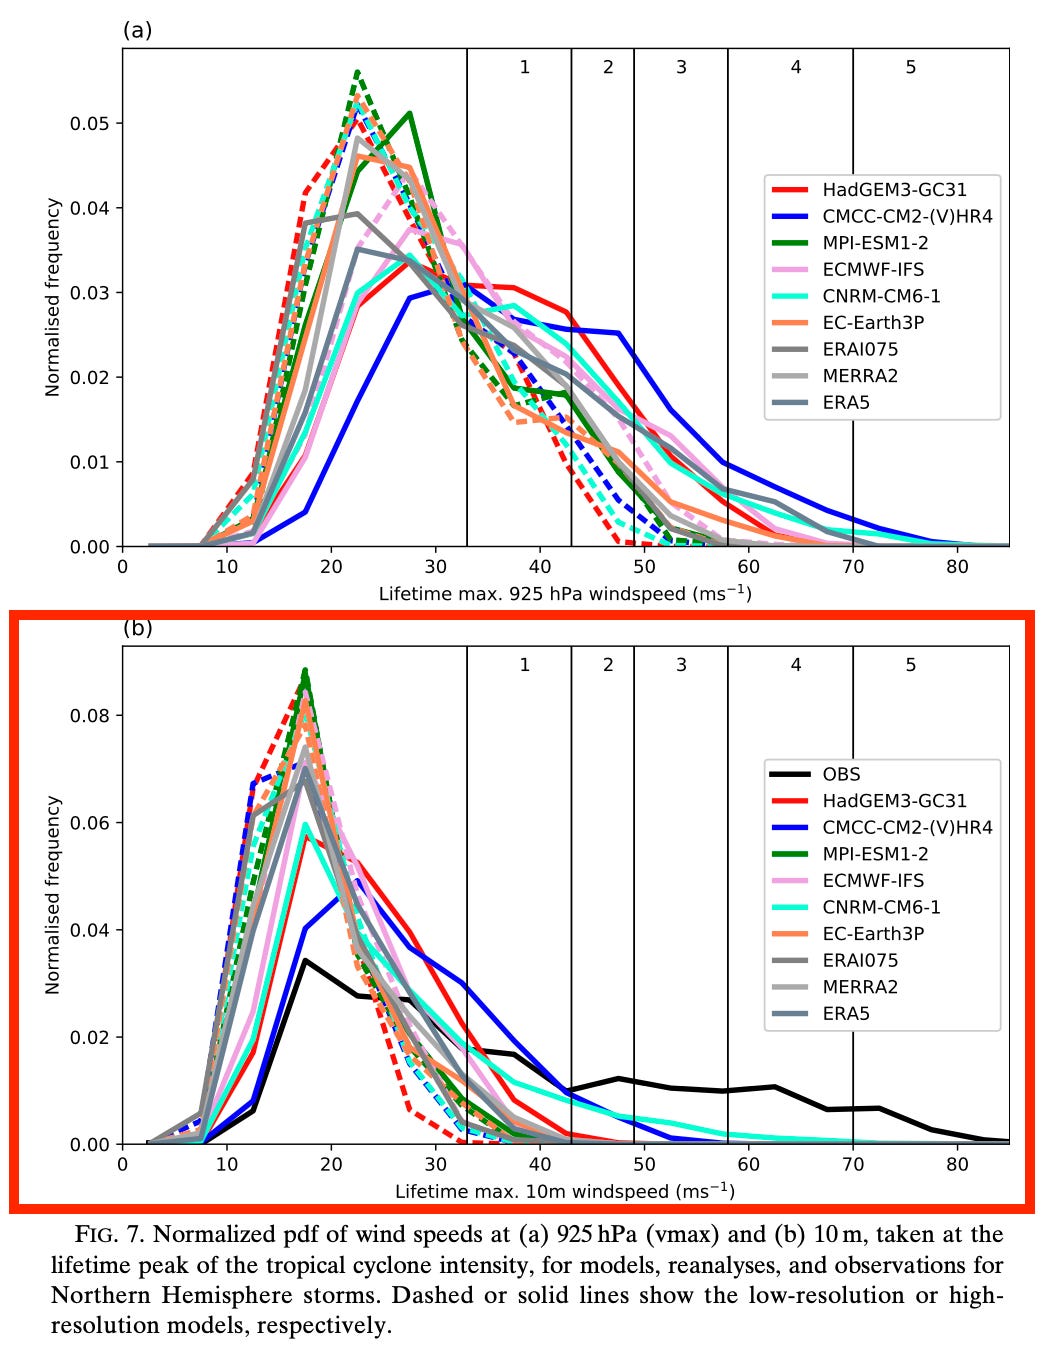
The black line indicates reality. The dashed lines are the usual lower res models, while the solid lines are the higher res models. It’s clear that there is some improvement from higher res models, but the models still simulate TC wind speeds that are significantly lower than reality.
In summary, the higher-resolution models are able to produce more intense TCs in terms of 10-m wind speed and surface pressure. Only the CNRM-CM6.1-HR model is able to simulate above category-3 10-m wind speeds, and hence these models do not have the capabilities of some other models at around 25-km resolution
We can see from the sample of graphics produced here that climate scientists are hard at work trying to assess climate models systematically, and of course at trying to improve climate models.
Tropical cyclones in current climate models still have a long way to go.
References
Impact of Model Resolution on Tropical Cyclone Simulation Using the HighResMIP–PRIMAVERA Multimodel Ensemble, Malcolm John Roberts et al, American Meteorological Society (2020)
In the conclusion of the paper, they write:
"There are several seemingly consistent changes when resolution is increased:
- increased tropical cyclone frequency and seasonal ACE index in the North Atlantic,
- improved capability to represent the spectrum of tropical cyclone intensities, and
- improved distribution of tropical cyclone tracks (and genesis regions)."
I noted on the first point that generating more isn't necessarily good. On the second point this is definitely the case, but quite a way from actual.
In AR6 they have quite an optimistic conclusion about higher resolution models and TCs, but we'll come to that later.