In #1 we looked at the trends in intensity and frequency of landfalling tropical cycles (TCs) over 120+ years. In #2 we looked at the same metrics out over the ocean using satellite data, which is available for about the last 40 years. And in #3 we looked at “translation speed” or changes in the speed at which the overall TCs are moving.
We’re looking primarily at what the IPCC 6th Assessment Report (AR6) has to say, from section 11.7.1.2 “Observed Trends”.
I was expecting to review what this section said about trends in TC rainfall. The simple climate science idea is that warmer air holds more moisture. As the planet warms we expect more rainfall. This idea will be explained in more detail in future articles on floods.
Here’s the plain English version of trends in TC rainfall from the report:
.
.
It’s not mentioned in the section on Observed Trends. I was surprised.
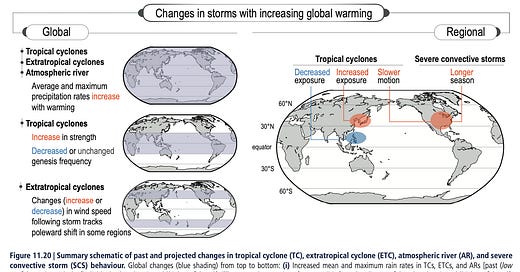
There is a graphic on p. 1586 with one caption:
Increased mean and maximum rain rates in past TCs (low confidence due to lack of reliable data)
“Low confidence” in IPCC reports basically means “we don’t know”.
For reference, here is the graphic:
But there’s no discussion in the text of “Observed Trends” on the data issues. The summary to this subsection doesn’t mention increased rainfall.
The section on “Detection & Attribution” does mention rainfall:
There is high confidence that anthropogenic climate change contributed to extreme rainfall amounts during Hurricane Harvey (2017) and other intense TCs.
Attribution is a different subject from trends, and we’ll be taking a closer look at attribution in later articles.
References
Seneviratne et al, 2021: Weather and Climate Extreme Events in a Changing Climate. In Climate Change 2021: The Physical Science Basis. Contribution of Working Group I to the Sixth Assessment Report of the Intergovernmental Panel on Climate Change


Are there any trend charts in the IPCC report with statistical analysis for Trends in rainfall in TCs?