Extreme Weather #7 – Trends in Extreme Rainfall
In #1 - #6 we looked at trends in tropical cyclones from chapter 11 on extreme weather of the IPCC 6th Assessment Report (AR6), with a summary article.
Now we’ll take a look at Extreme Rainfall. It’s needed to understand changes in floods.
There are a number of ways to characterize extreme rainfall - so it’s more complicated than something like annual rainfall which only has one number.
The idea is that even without annual rainfall changing there can be a shift towards more rainfall falling in a given day or a short period - more dry days, more intense rainfall on fewer rainfall days. If you have more extreme rainfall you have more chance of floods.
Warm air holds more moisture, so in a warmer climate we expect more rainfall. The actual physics is more complicated as another factor pushes the other way. A topic for another day. This article is about trends - what do we observe?
The trends are positive - an increase in extreme rainfall globally. This is bad news. You might want more rainfall for your region, but it’s unlikely you want it all falling in a few days.
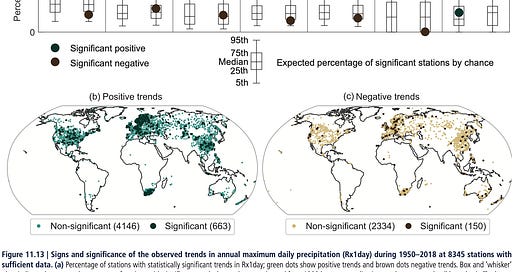
Here’s a graphic from AR6 showing trends in one measure (annual maximum one day precipitation) in the last 70 years:
For people new to actual climate science it might be surprising to find that “extreme rainfall rising” actually means rising in some places and falling in other places. This is normal in climate.
What’s also interesting from the excellent graphic above - which separates out positive trends in the map on the left from negative trends in the map on the right - is that most regions have both positive and negative trends.
As already mentioned, there are quite a number of different “extreme” metrics - in one paper on Australia I counted 10. There are also different ways to summarize a given metric - in the example above we see “significant trends” in Rx1day. After reading Andrew Gelman’s blog on statistics for a number of years I’m not a fan of trying to separate non-significant and significant - an arbitrary and often meaningless divider. It’s better just to see what the data shows.
Here’s another example, from Dunn et al 2020, of a different metric where they just consider the percentage changes. This metric is “R95pTOT” which is calculated by summing the accumulated rainfall on “very wet days”. And a very wet day is defined as being greater than the 95th percentile of “wet days”.
Top left we see the decadal trends over 70 years of data - the color code underneath shows % per decade.
There’s clearly a lot more places with increasing extreme rainfall than decreasing rainfall. This is bad news.
Of course, when a flood occurs anywhere there’s usually a media frenzy attributing it to climate change, even if it’s a place with a reduction of extreme rainfall over the last half century. But clearly global increases in extreme rainfall lead us to expect more floods globally.
For people interested in seeing more, Sun et al 2021 and Du et al 2019 are good places for more graphs and commentary. References below. Most papers are accessible for free via scholar.google.com - just type in the title and when the result comes up if there’s a pdf on the right it’s non-paywalled. Sometimes no pdf appears but clicking on the main link takes you to the journal and still the paper is freely available. It’s been a refreshing change in climate journals over the last decade.
Notes
The summary on trends in extreme rainfall from p. 1560:
In summary, the frequency and intensity of heavy precipitation have likely increased at the global scale over a majority of land regions with good observational coverage. Since 1950, the annual maximum amount of precipitation falling in a day, or over five consecutive days, has likely increased over land regions with sufficient observational coverage for assessment, with increases in more regions than there are decreases.
Heavy precipitation has likely increased on the continental scale over three continents (North America, Europe, and Asia) where observational data are more abundant.
There is very low confidence about changes in sub-daily extreme precipitation due to the limited number of studies and available data.
References
Seneviratne et al, 2021: Weather and Climate Extreme Events in a Changing Climate. In Climate Change 2021: The Physical Science Basis. Contribution of Working Group I to the Sixth Assessment Report of the Intergovernmental Panel on Climate Change
Development of an Updated Global Land In Situ‐Based Data Set of Temperature and Precipitation Extremes: HadEX3, Robert J. H. Dunn et al, JGR Atmospheres (2020)
A Global, Continental, and Regional Analysis of Changes in Extreme Precipitation, Sun et al, AMS (2021)
Precipitation From Persistent Extremes is Increasing in Most Regions and Globally, Haibo Du et al, GRL 2019


