

Extreme Weather #9 – Trends in Floods - Streamflow
Extreme Weather #9 – Trends in Floods - Streamflow

In #8 we looked at the overview on floods. The IPCC report, AR6, says:
Flooded area is difficult to measure or quantify and, for this reason, many of the existing studies on changes in floods focus on streamflow. Thus, this section assesses changes in flow as a proxy for river floods, in addition to some types of flash floods.
As we saw in #7, extreme rainfall has increased in more places than it has decreased around the world. So we would expect rivers and waterways to reflect that and cause more flooding.
Here’s what the report says in plain English:
Peak streamflow has reduced overall - decreased in more places than it has increased. This is opposite to the trend in extreme rainfall.
The text is below in the notes.
This is good news.
The main paper cited for the global data is Do et al 2017:
..trends in extreme precipitation are not likely to be the only climatic factor influencing flood hazard, so that it is not possible to infer the direction and/or magnitude of change in flood hazard from information about changes in extreme precipitation alone.
The aim of the paper:
In order to better understand historical changes in flood hazard at the global scale, this paper therefore aims to improve the current understanding of changes to flood hazard by studying changes in the magnitude of annual maximum streamflow from a large global dataset of daily streamflow observations.
There are over 9,000 monitoring stations around the world. Do and his colleagues create a few subsets based on criteria of: length of time; amount of missing data and some quality control checks. Here’s their graphic, I’ve annotated the three maps with green text:
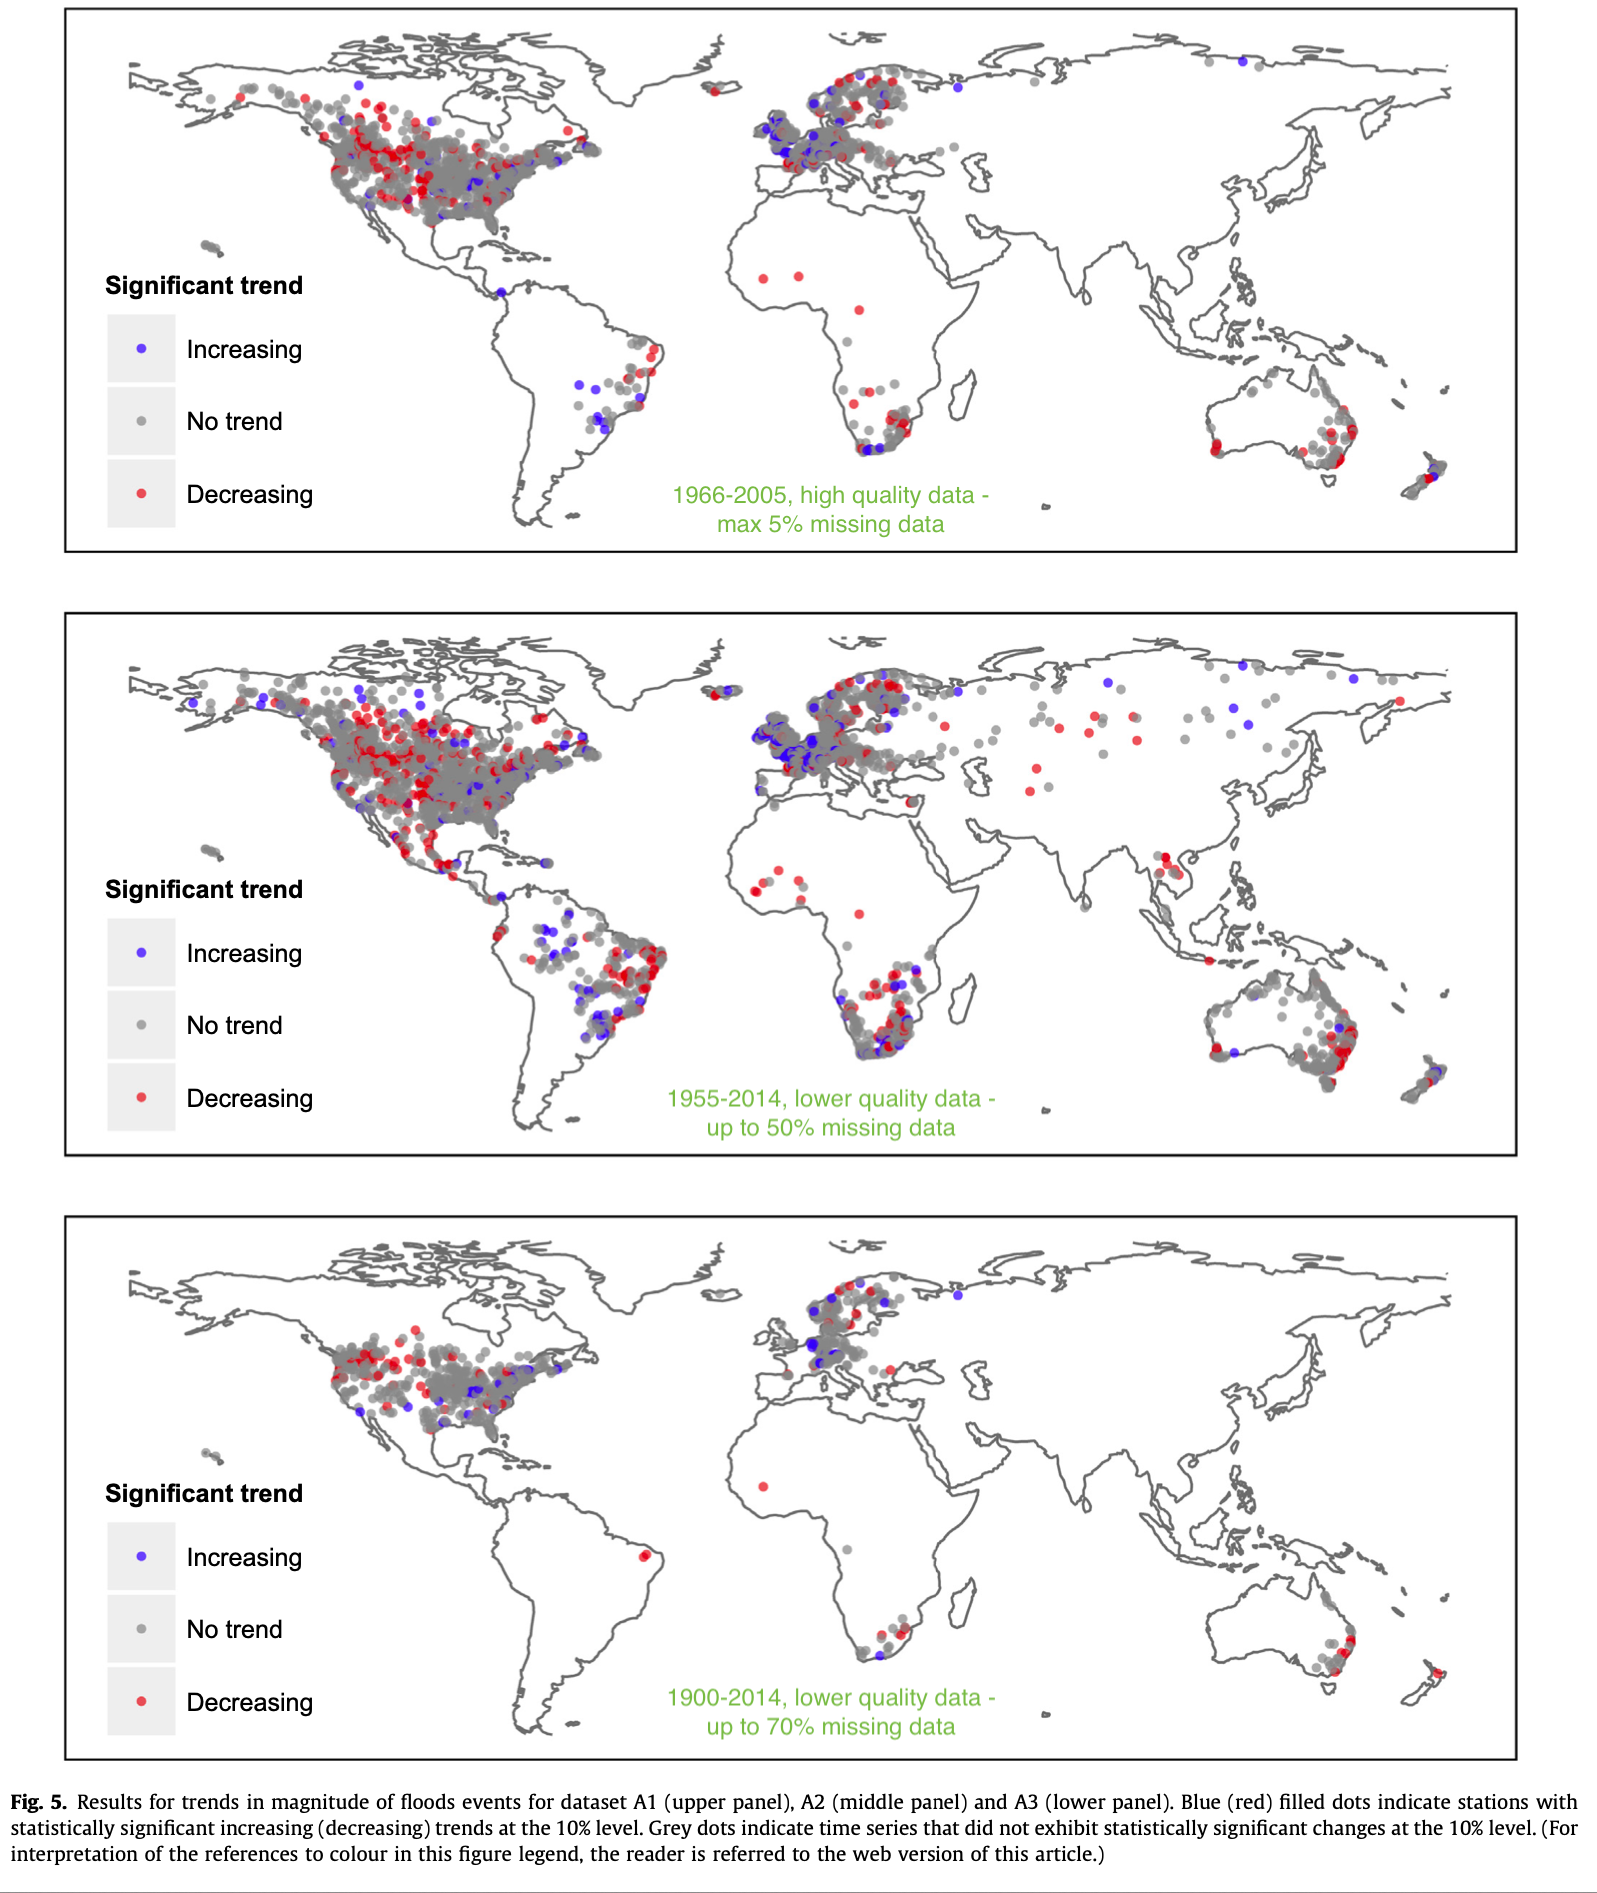
Interestingly, more stations showed statistically significant decreasing trends than statistically significant increasing trends for all datasets.
We’ll take a look at how this is summarized in the report in the next article.
Notes
Text of AR6 from p. 1568 about peak streamflow:
Peak flow trends are characterized by high regional variability and lack overall statistical significance of a decrease or an increase over the globe as a whole. Of more than 3500 streamflow stations in the USA, central and Northern Europe, Africa, Brazil, and Australia, 7.1% stations showed a significant increase, and 11.9% stations showed a significant decrease in annual maximum peak flow during 1961–2005 (Do et al., 2017). This is in direct contrast to the global and continental scale intensification of short-duration extreme precipitation (Section 11.4.2).
References
Seneviratne et al, 2021: Weather and Climate Extreme Events in a Changing Climate. In Climate Change 2021: The Physical Science Basis. Contribution of Working Group I to the Sixth Assessment Report of the Intergovernmental Panel on Climate Change
A global-scale investigation of trends in annual maximum streamflow, Hong X. Do et al, Journal of Hydrology (2017)
Floods are one area area where humans have been successfully adapting for a long time. Better forecasts have also been helping us adapt to both floods and hurricanes. In both of these cases, one might say were have been mostly adapting to the existing climate rather than changing climate. Skeptics might argue that 1 degC of warming (mostly in winter and at night) isn't a big change that requires adapting to.
IIRC, there are number of weather phenomena associated with flooding. The first phenomena are stationary weather fronts ("cutoff" low pressure systems) that cause excessive rain to fall in one place, say the Mississippi river basin. This is probably what is being quantified by streamflow. It would be interesting to know if the atmospheric rivers that have been drenching California with rain and burying it under 40 feet of snow are associated with a stationary front in the Pacific or some other phenomena. The second phenomena are localized flash flood enhanced by the extra water vapor carried by warm air. The change here is big, but highly localized and probably not easily detected by streamflow. You've already mentioned more flooding from slower moving hurricanes.