
GPT-5 and Research #2
Data analysis

How did I produce the graphs in Recent Trends in Tropical Cyclones: Satellite data from over the oceans?
A while back I found the data - a large csv file. I had a brief look but I didn’t have time to dive into it.
A couple of weeks ago I bought an updated version of Matlab (my old version no longer worked). I have barely used Matlab in a few years so I’ve forgotten most of the syntax - and there are many new features.
I subscribe to GPT-5. It costs a few cups of good coffee a month and is worth it many times over.
I asked “Where is the global data on tropical cyclones?” and it reminded me it was the International Best Track Archive for Climate Stewardship (IBTrACS) project, and gave me the website and the technical documentation.
How do I load this large csv file into Matlab? A few years ago I would have gone to Matlab documentation, then struggled with the mix of data types. Hours later I might have got the data into a Matlab matrix.
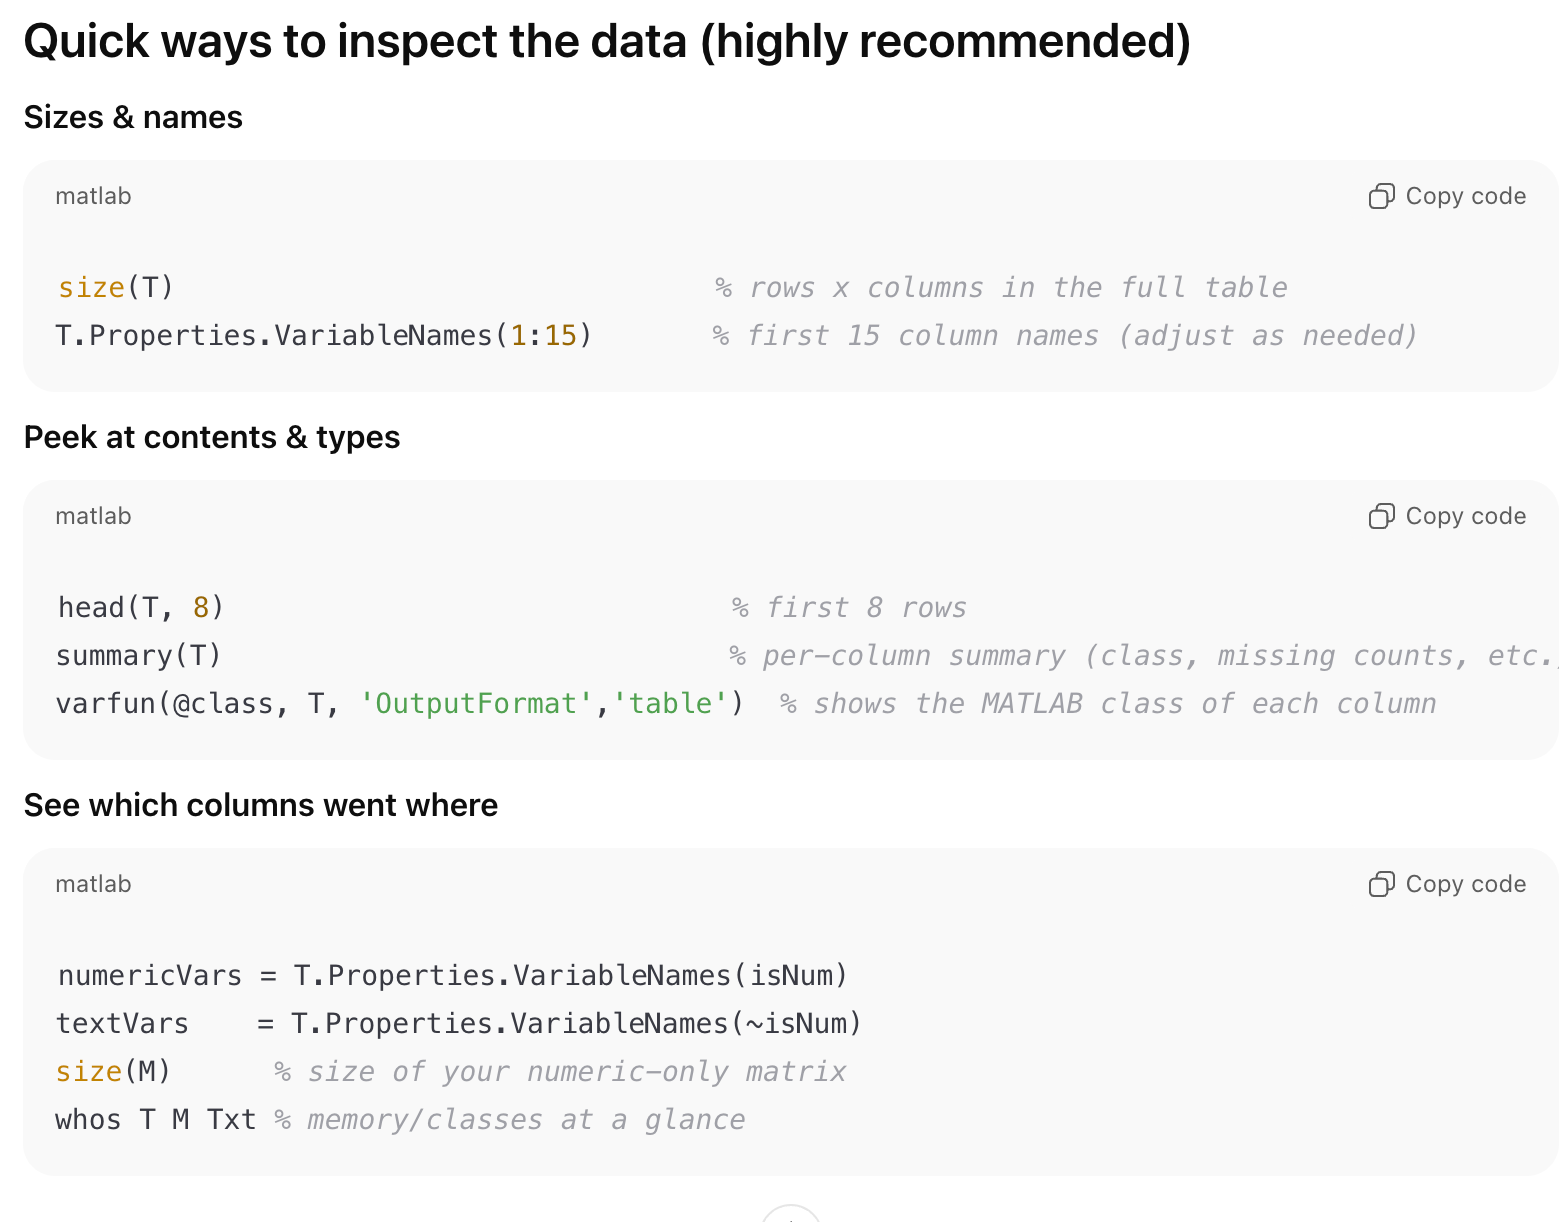
Today, I asked:
First, let’s upload the csv into a matrix. The top row has headings. We can’t pull the headings into a numeric matrix. Most columns are numeric, but at least one is descriptive text.
GPT-5 gave me code using a modern MATLAB approach that handles mixed data types, and suggested:
Would you like to run that next and see what the first few variable names and types look like? (That’ll help us identify which columns are text and which are numeric before we start extracting the Best Track data.)
I agreed, and I got this kind of result - note that in each section I can just click the Copy code icon and run that to check results.
From there, we kept going. GPT-5 is definitely not just a coding engine. It looked through the technical documentation and explained that the WIND field (my primary interest) is empty in some places and what we need to do is check all the other WIND fields (from each reporting organization). It wrote the code to pull the relevant data together.
We made some progress. Then I explained:
We currently have a row per measurement, tracking each TC across its life. What we want now is to create a new table with one row per TC:
SID - reference number of each TC
Date - start date/time when the TC was first tracked
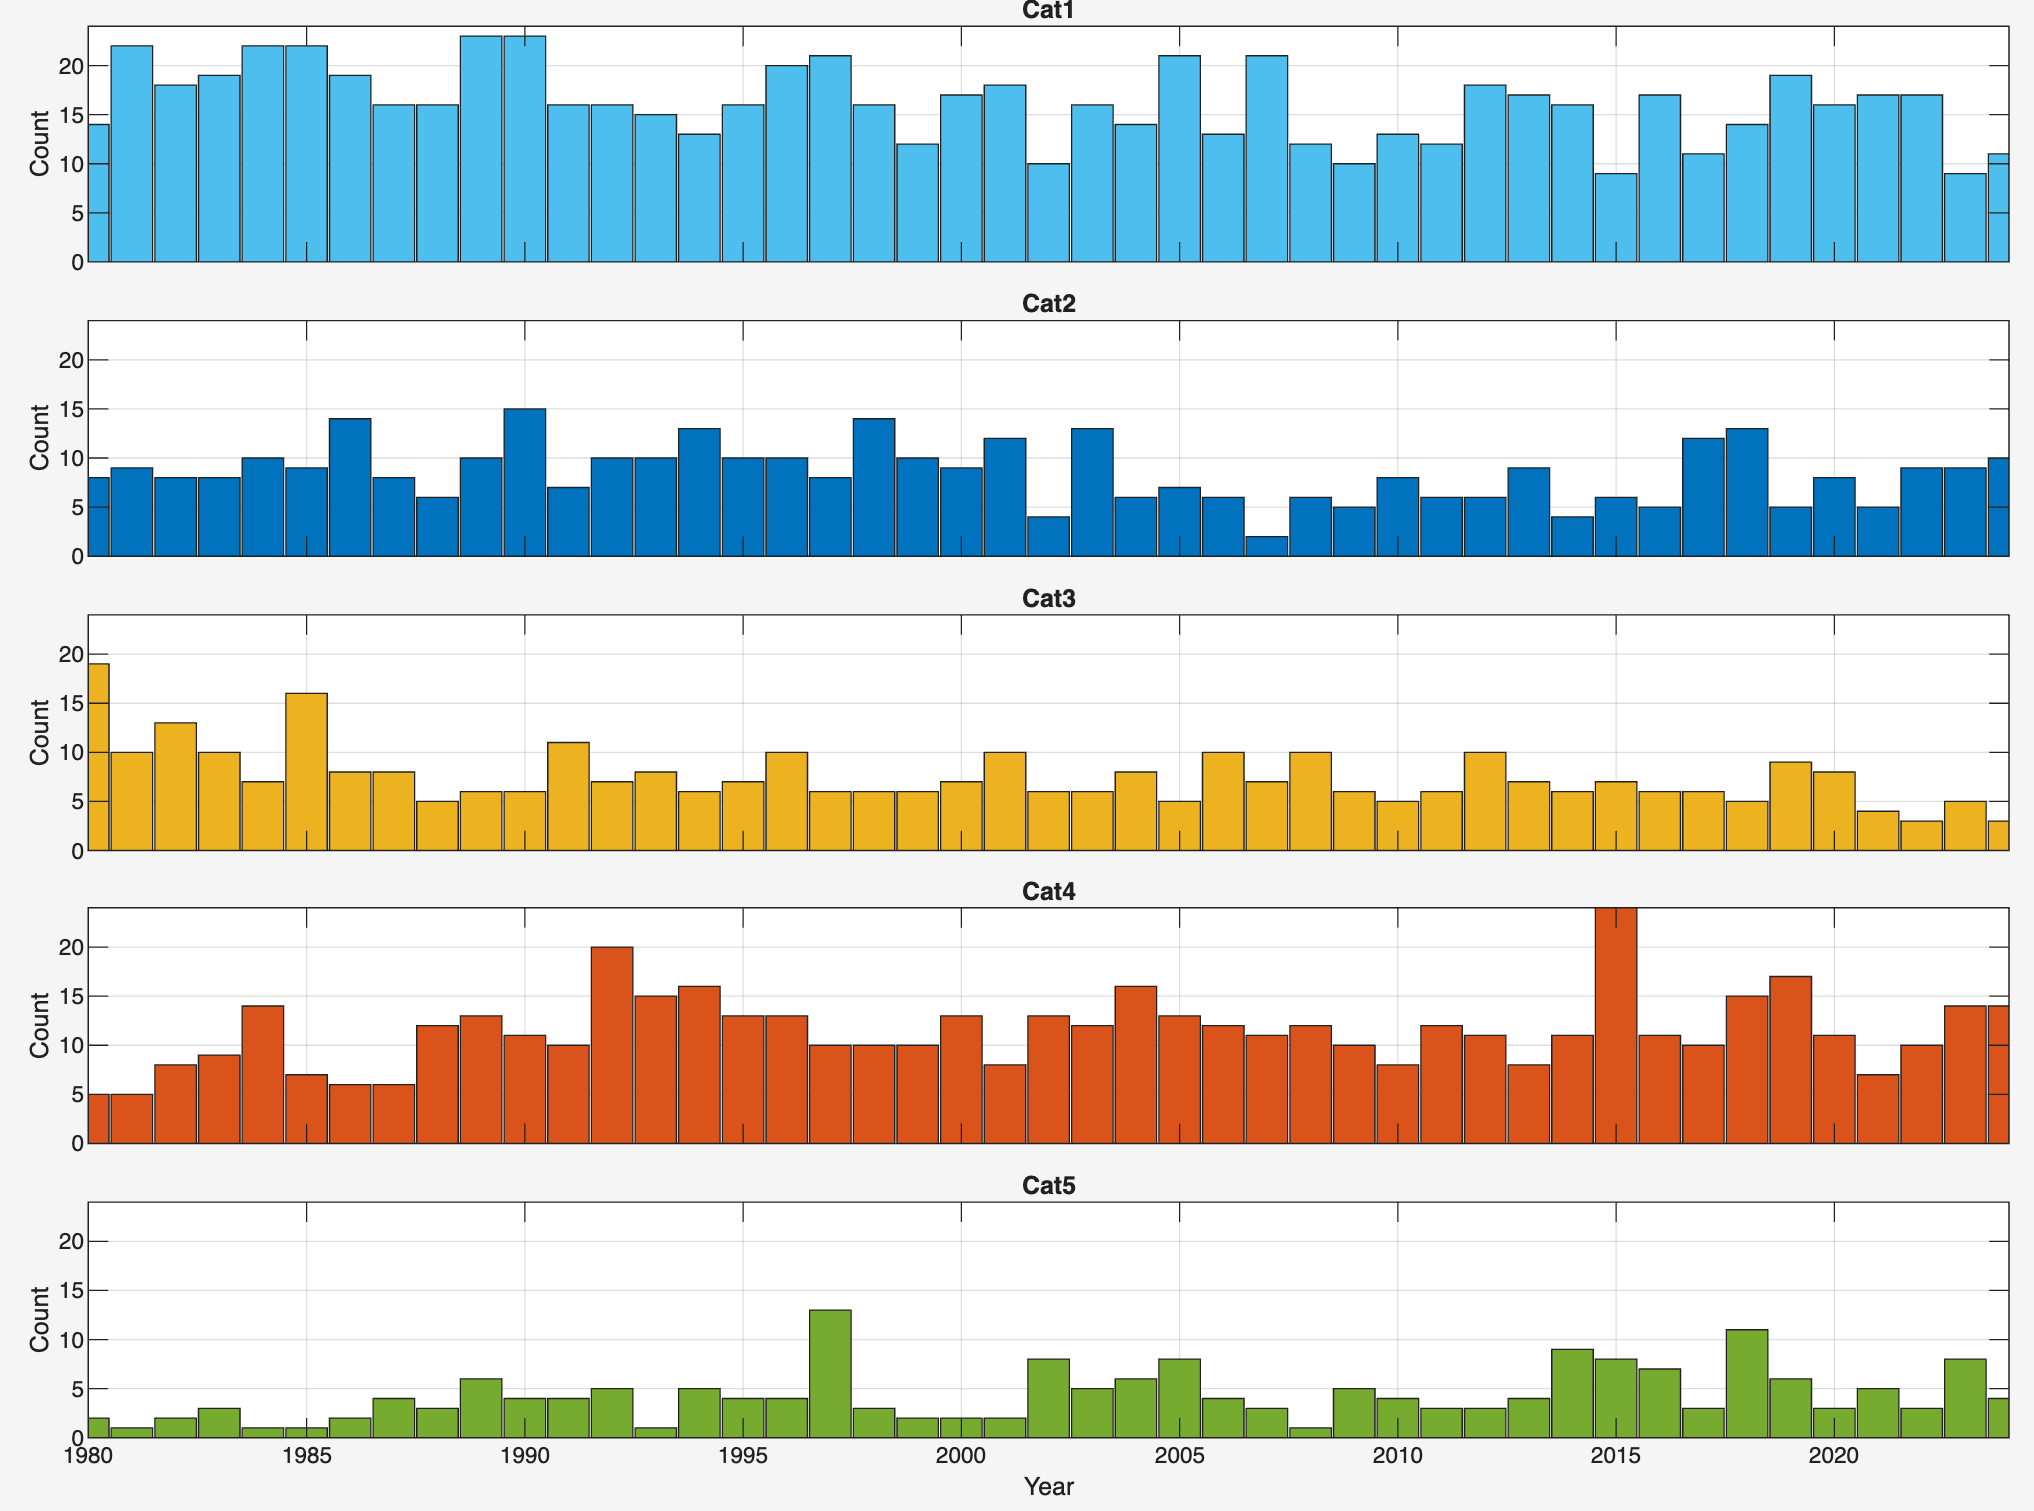
Year - so we can do some annual histograms
Max wind speed
Min pressureThen plot a histogram of number of TCs - by year..
No problem - it generated all the necessary code.
When I ran some code and had some errors, it was able to “figure out” what was going on from the error messages and produce revised code.
But its real world intuition is sometimes not great. The first histogram had nothing for 2000.
Good eye — a blank year usually means how we’re defining “Year” dropped 2000. The most common reasons:
We used start date, and many 1999/2001 storms straddle 2000 (so none start in 2000).
I had to keep pulling my assistant back to reality.
I still believe you have misunderstood the physical reality here. There are about 40-60 TCs per year, every year. The odds that in the year 2000 the TCs drop to zero are incredibly low - so it’s probably a code issue to do with the zeros in 2000.
It kept suggesting spurious reasons why the number was zero. However, we did get it resolved.
And when I say “we”, I mean together. Which is a strange concept if you haven’t tried to use GPT-5 to solve a problem.
There are areas with specific syntax like plotting graphs where in the past I would have spent a lot of time trying to get a plot looking right, and if there were two plots, even longer getting the colors or y-axes consistent. Automatically generated legends were always a time-consuming exercise.
In a minute or two GPT5 has the code just how you want it. If it’s not exactly what you want, you ask for an alteration and you usually get it.
It might give me a block or two of code, and when I was unsure which bits of the old code to overwrite I would say, “I’m going to give you the whole section, please paste in the new code so I have a fresh copy of this section” and 1-2 minutes later it would be ready to copy and paste in.
But again, it’s not just a coding engine. Here was my question:
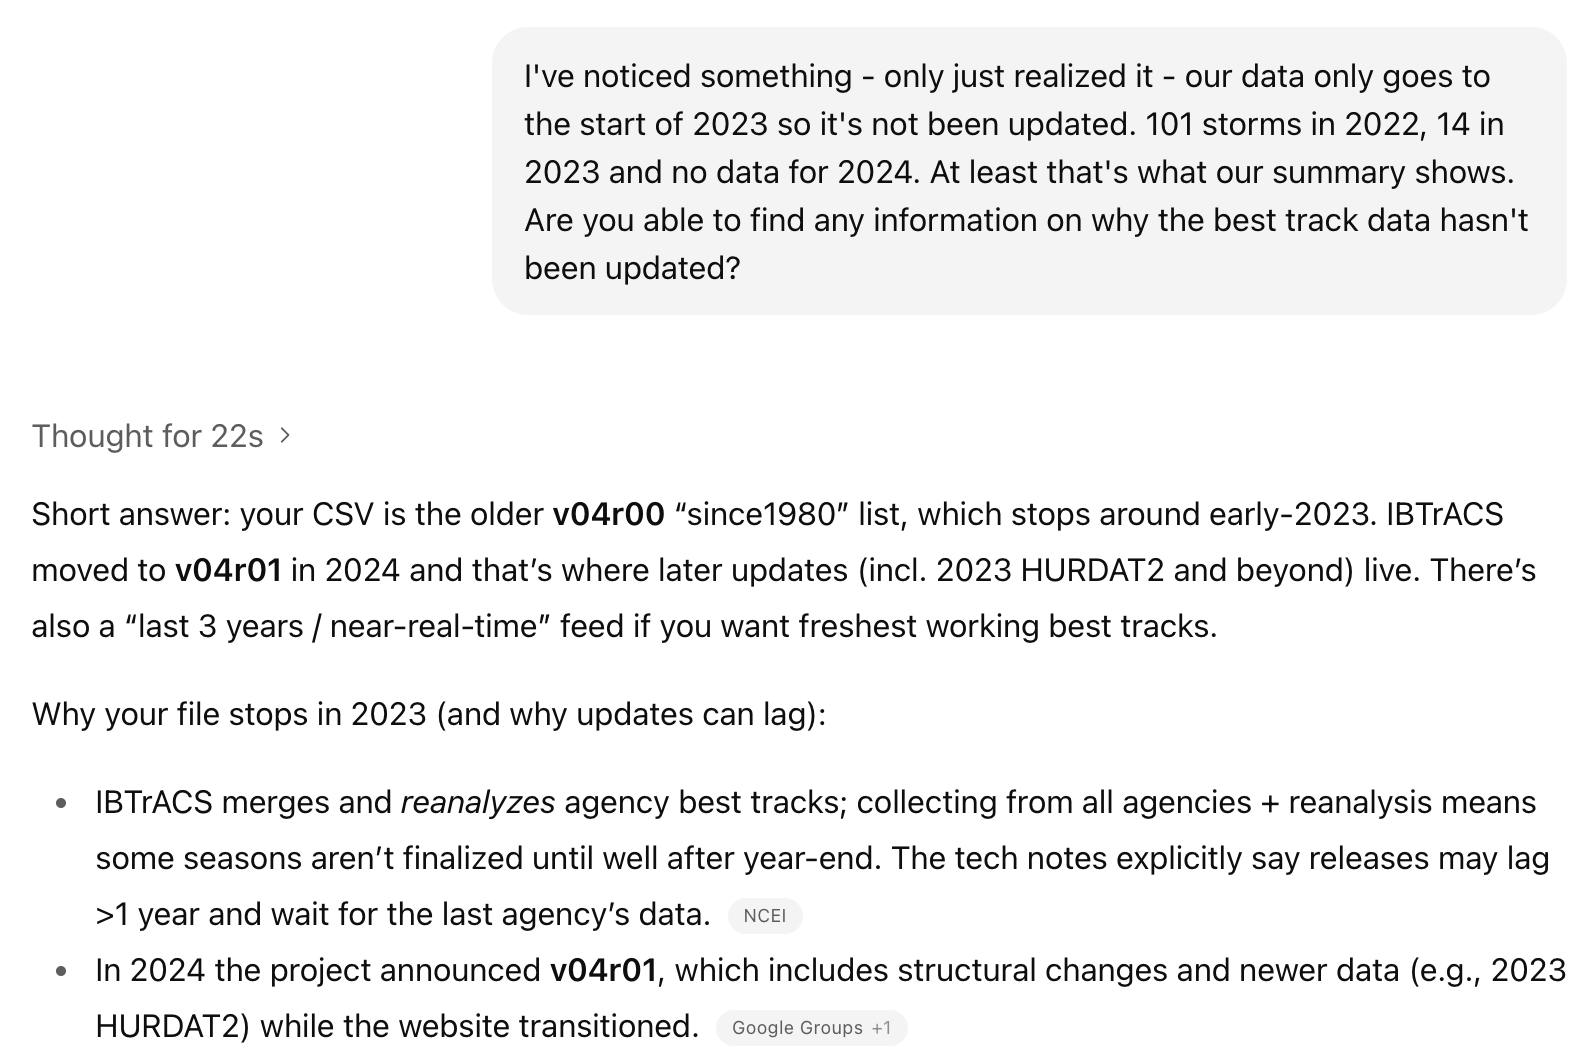
I’m used to diving into documentation to figure out where the data is and how good the data is.. but GPT5 got the answer right away. It saved me the work.
Overall, because I was extremely rusty with Matlab I would have probably spent 5-10x as long figuring out how to do the data extraction and graph plotting.
Here’s another example. I asked GPT5 to produce some code for overlaying the plots of the top 100 TCs - wind speed vs time since they hit category 4 status. Then I wanted to check it:
Back to the tropical cyclone matlab project we’re working on. I need to look in some detail at the “top 100 storms that go into category 4 or above status” - here’s one section of the code you wrote:
..
Can you explain in simple terms what each line of the code does, and what do variables G, G2 and sidu represent?
Here’s part of the reply:
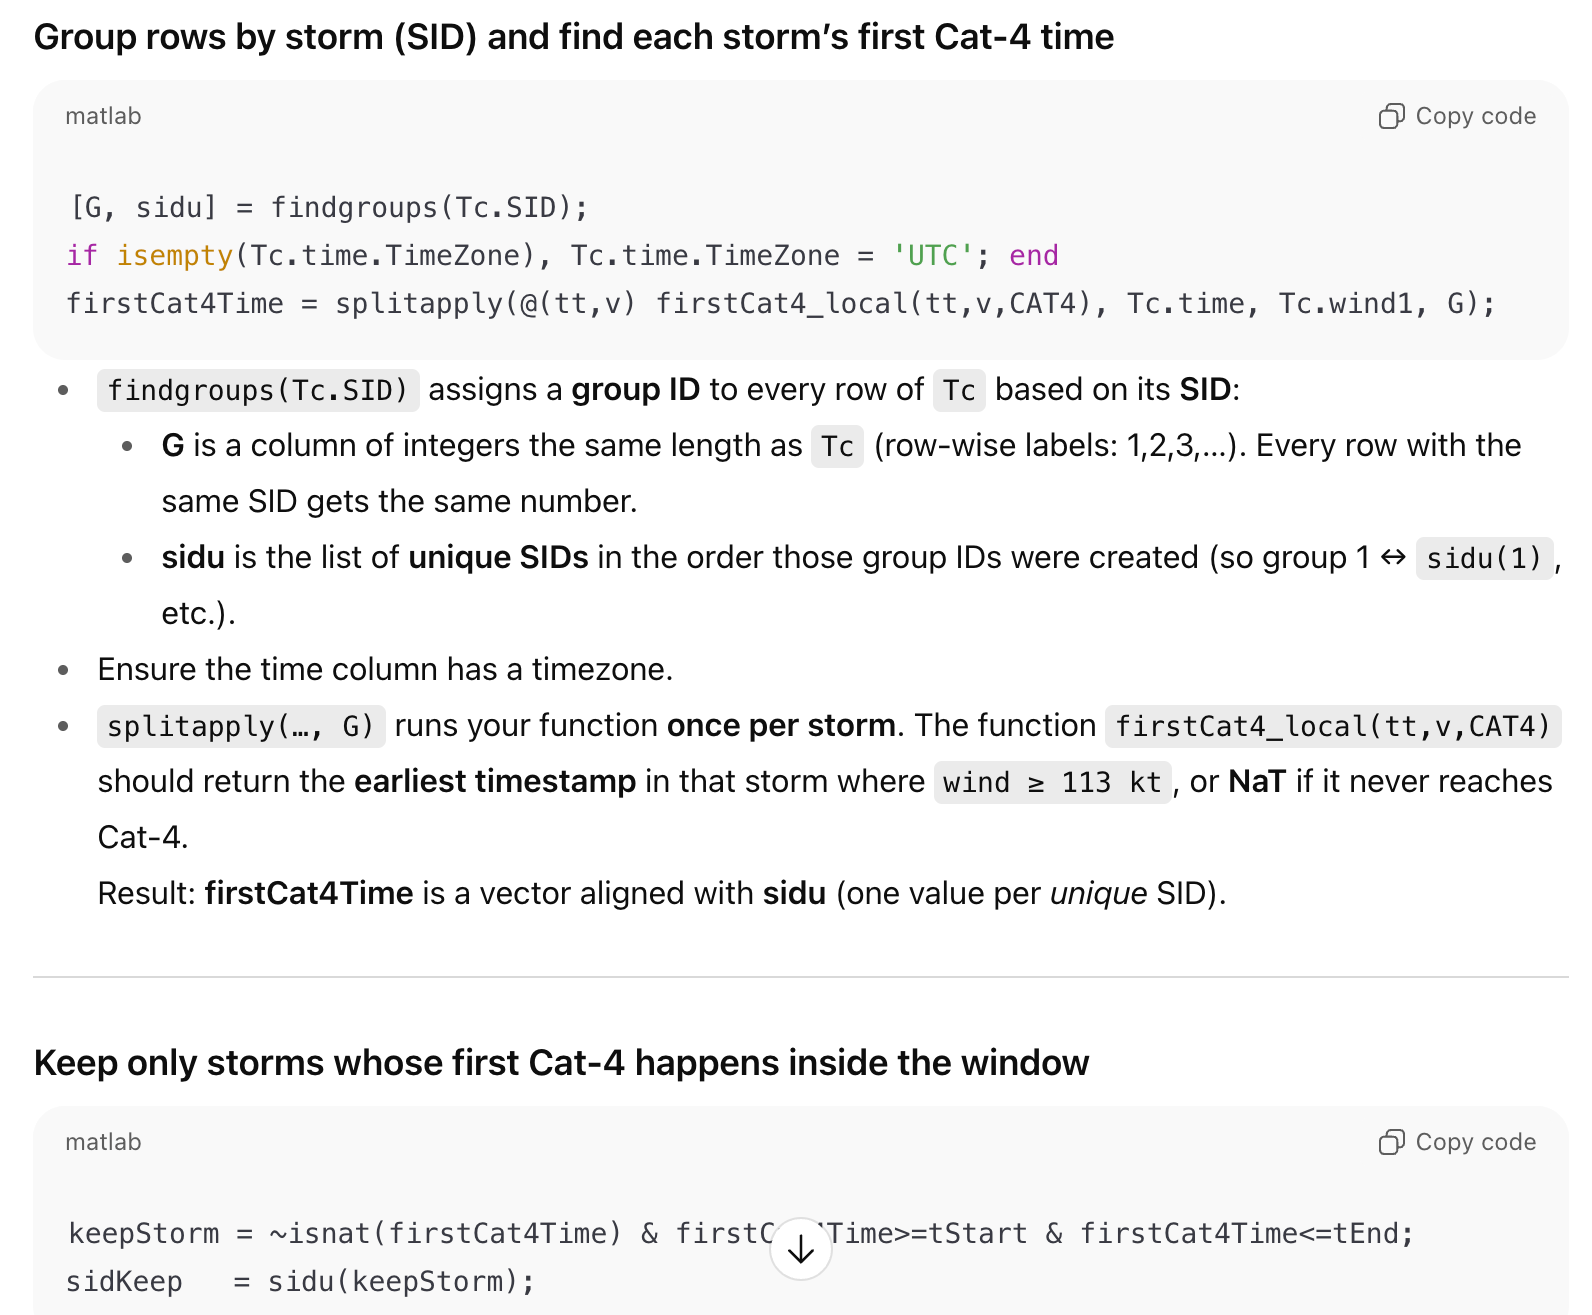
In a couple of places I drilled down, asking for more clarification until I was confident about what was going on.
Incredible.
If you want to learn, GPT-5 can make you many times more productive - it’s like having a grad student sitting next to you. But it’s a grad student in every single field.
Thank you. I hve dabbled in an AI program and found much value too. As you showed, the key is that you have to have intelligence to use AI but when you do it can get a lot done much quicker.
Thank you. This is fascinating, Steve, and no doubt extremely helpful to others with similar presentation objectives. At age 85, I'm probably too old, mentally and energy limited to take advantage of GPT-5 and its potential, but after many very helpful experiences with free ChatGPT, and a few less helpful ones where I suggested new data links, and it apologized for its ignorance, I will probably upgrade to ChatGPT 5.0.