

Summary on Trends in Extreme Rainfall and Floods and Missing Good News
Summary on Trends in Extreme Rainfall and Floods and Missing Good News

In #9 we looked at trends in peak streamflow. As there isn’t a global database of floods this is the best proxy for flood risk from rivers and waterways. The result was a surprising decrease globally - the trend was down in some stations and up in others, but the down outweighed the up. This is good news.
And it’s the opposite of the trend in extreme rainfall, which was bad news.
On the subject of extreme rainfall, AR6 summarises it like this, p. 1560:
In summary, the frequency and intensity of heavy precipitation have likely increased at the global scale over a majority of land regions with good observational coverage
On the subject of peak streamflow, here is the AR6 summary, p. 1568:
In summary, the seasonality of floods has changed in cold regions where snowmelt dominates the flow regime in response to warming (high confidence).
There is low confidence about peak flow trends over past decades on the global scale, but there are regions experiencing increases, including parts of Asia, Southern South America, north-east USA, north-western Europe, and the Amazon, and regions experiencing decreases, including parts of the Mediterranean, Australia, Africa, and south-western USA.
[Emphasis added].
There are two items that stand out:
The summary doesn’t mention the good news
Peak flow trends are “low confidence”
The obvious conclusion is that the writer of the report tasked with this summary has an aversion to reporting good news.
The heavy precipitation could equally be described as “up in some places and down in others”, but the summary said “increased”. For consistency, the summary of peak streamflow could say:
Peak flow trends have decreased over a majority of land regions with good observational coverage
Here is the graphic of extreme rainfall from the report. We saw it in the article on extreme rainfall:

Here’s the graphic of the stations used for their high quality 40 year trends (less than 5% missing data), also seen in the last article:
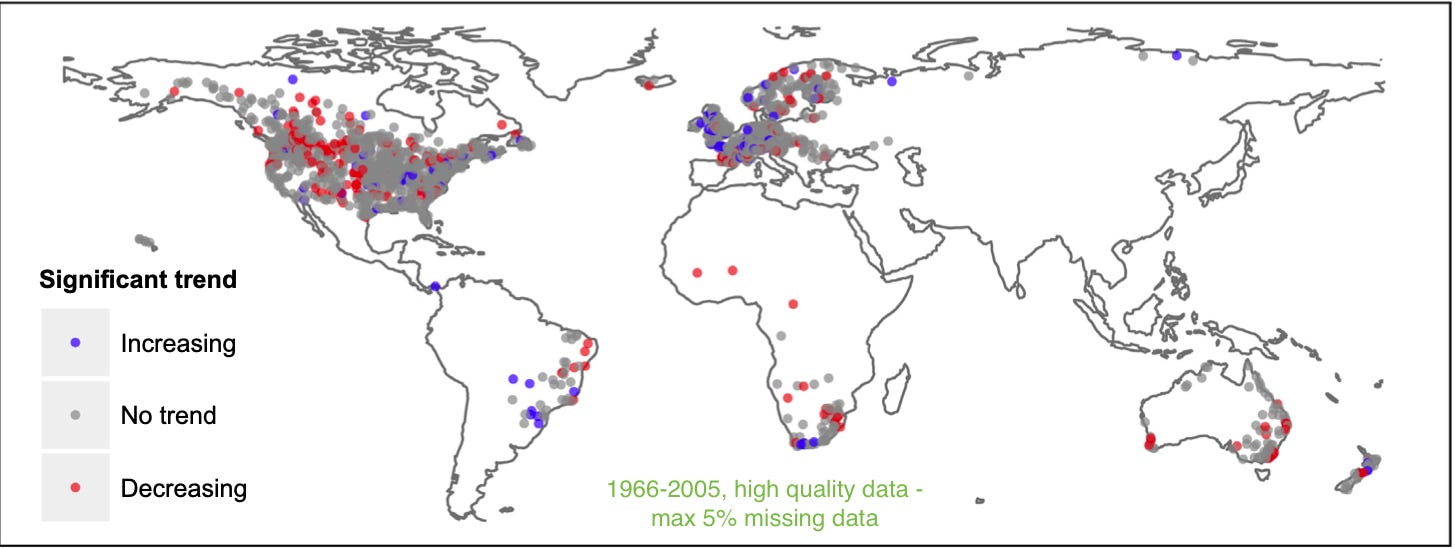
There’s definitely less coverage compared with the precipitation data, but the precipitation data also has major gaps.
The text of the report doesn’t indicate why there is low confidence in the result. The paper doesn’t think it’s low confidence. I emailed Hong Do for any clarification but didn’t get a reply.
I plan to take a longer look at what makes it into the executive summary for chapter 11 in a later article but here’s the executive summary on this exact subject from p.1518:
Significant trends in peak streamflow have been observed in some regions over the past decades (high confidence).
So now we have high confidence in the trends instead of low confidence in the trends but still no mention of good news. Someone scanning the executive summary given that no good news is mentioned will likely assume “significant trends” is an increase.
Pulling together a massive report is a challenge and different individuals will make different choices on how they summarize a summary.
But there does appear to be an aversion to reporting good news.
In the notes below, I’ve included a few extracts from Hong Do’s paper for interest. Unfortunately, you need academic access to read the whole paper.
Notes
Extracts from Hong Do et al 2017:
As can be seen, over the main reference period (dataset A1; 1966– 2005), there were 7.1% of stations with statistically significant increasing trends (corresponding to 136 stations; Fig. 4a), and 11.9% of stations with statistically significant decreasing trends (corresponding to 226 stations; Fig. 4b).
The percentage of stations exhibiting statistically significant increasing trends is consistent with the null hypothesis of no change on average across the global dataset, whereas the percentage of stations showing significant decreasing trends is inconsistent with the null hypothesis.
Then they review the longer time series A2 and A3 (see the graph in the last article) for annotation:
Comparing the results from the main reference period (dataset A1) to the other two reference periods, it is evident that the percentage of stations with significant increasing trends changes from 7.1% (Fig. 4a), to 11.8% for dataset A2 (Fig. 4c) and 16.4% for dataset A3 (Fig. 4e).
A similar pattern is evident for stations with decreasing trends, with the percentage of stations showing decreasing trends changing from 11.9% (Fig.4b), to 15.4% for dataset A2 (Fig. 4d) and 22.9% for dataset A3 (Fig. 4f).
With the exception of increasing trends in dataset A1, all results are field significant at the 10% (two-sided) significance level, even when the moving- blocks bootstrap (block size of two) procedure was adopted. Interestingly, more stations showed statistically significant decreasing trends than statistically significant increasing trends for all datasets.
[Emphasis added]
Furthermore, stations showing significant increasing trends were outnumbered by stations showing significant decreasing trends in all three datasets, indicating that although there may be evidence of regional increasing trends in flood hazard, the hypothesis that there is a significant increase in flood hazard when averaged over all the data-covered regions of the globe is not supported by this analysis.
Then they go on to review a subset of data excluding monitoring stations which don’t have dams:
There are multiple systematic factors that could explain these findings, which are investigated in the following sections, such as the influence of dams and other forms of human activity. As dataset A1 provides a reasonable compromise between data length and spatial coverage, we focus on this dataset in the following sections..
..Although the above results suggest that the presence of large dams does not substantially influence the overall trend results, from a hydrological perspective, large dams would be expected to have a significant effect on flood flows, as in many cases the dams are designed to reduce flood magnitude and the flood damage on human assets (FitzHugh and Vogel, 2011; Jaramillo and Destouni, 2015; Lajoie et al., 2007). On this principle, the remaining analyses are focused on the ‘‘no dams” case (i.e. dataset B2) to minimise the influence of large hydraulic structures on any trend results.
In their conclusion:
Neither the presence of dams nor changes in forest cover had a large effect on the trend results (although most analyses were conducted using the ‘‘no dam” dataset to minimise the potential influence of large hydraulic structures on results). The lack of a conclusive finding regarding the influence of forest cover suggests that forest cover may not play a dominant role explaining trends in flood hazard..
..Despite potential concerns about data quality, one interesting pattern to emerge was that detected changes in annual maximum streamflow are inconsistent with the evidence of trends in precipitation. At the global scale, annual maximum precipitation intensities were found to have increased (Min et al., 2011) and a large-scale increasing pattern in extreme precipitation was detected (Lehmann et al., 2015), with North America experiencing more increasing trends than decreasing trends in annual maximum precipitation (Westra et al., 2013). These precipitation-based results therefore appear to be inconsistent with the trend results for floods found in our analysis, and indicate the potentially important role of changes in catchment conditions and river morphology to changes in streamflow regimes (Hall et al., 2014; Merz et al., 2012a). Further research is needed to quantify the contribution of catchment condition to the rainfall-runoff relationship at global and regional scales, including investigation of changes in other dimensions of flooding, such as their duration, volume, and intensity.
References
Seneviratne et al, 2021: Weather and Climate Extreme Events in a Changing Climate. In Climate Change 2021: The Physical Science Basis. Contribution of Working Group I to the Sixth Assessment Report of the Intergovernmental Panel on Climate Change
A global-scale investigation of trends in annual maximum streamflow, Hong X. Do et al, Journal of Hydrology (2017)
Not only dams, but levees also prevent flooding. That's a good thing, but a downside is that for major river deltas, the lack of periodic flooding experienced before the levees result in river deltas receding due to the sediment sinking once the river meets the sea. Could be water wells contribute to the sinking of the deltas too. A misconception is that deltas are being overtaken by the oceans primarily due to sea level rise. Of course the seas are rising, but not at the rate that the deltas are sinking.
I posted the first section of this article in the original blog site with a link to this full article. There's a comment there that reduced peak stream flow isn't always good news.
I'm pasting my reply here:
---
Nathan,
I agree with you. I've oversimplified.
A few comments:
1. Brevity is not my strong point, and in this series I'm going for brevity. Over-simplification is the inevitable result.
2. This is from the section of the IPCC report on floods. The section is trying to assess recent trends in flood risk.
A reduction in flood risk can also be an increase in drought risk. Pluses and minuses in many aspects of climate.
I was struck reading one of the references on changes in snow melt, I think it was "Trends in snowmelt-related streamflow timing in the conterminous United States", R.W. Dudley et al 2017. There was less flooding from snow melt in the northwestern US, which led to greater fire risk.
Reduced flooding in some regions can be a negative - greater risk of droughts, greater forest fire risk due to drier ground.
But that idea isn't popular when you've just had floods in your region, especially if it was your house or your community.
3. Most people, even "very interested in climate" people, aren't going to read the 95 pages of the report on Extreme Weather (when you strip out the exec summary, the references and the tables at the end). It's hard to digest.
If there was a good summary of what was actually in the report, instead of just the negatives, it would be wonderful. My work would already be done. But we don't live in that world.
Anyway, I welcome your comment. I will endeavour to balance brevity and nuance.