
Natural Variability, Attribution and Climate Models #9
A Paper Examining how well Climate Models Match Reality

Originally, I thought we would have a brief look at the subject of attribution before we went back to the IPCC 6th Assessment Report (AR6). However, it’s a big subject.
In #8, and the few articles preceding, we saw various attempts to characterize “natural variability” from the few records we have. It’s a challenge. I recommend reading the conclusion of #8.
In this article we’ll look at a paper by G J van Oldenborgh and colleagues from 2013. They introduce the concept of assessing natural variability using climate models, but that’s not the principle idea of the paper. However, it’s interesting to see what they say.
Their basic idea - we can compare weather models against reality because we make repeated weather forecasts and then can see whether we were overconfident or underconfident.
For example, one time we said there was a 10% chance of a severe storm. The storm didn’t happen. That doesn’t mean we were wrong. It was a probability. But if we have 100 examples of this 10% chance we can see - did we get approximately 10 instances of severe storms? If we got 0-3 maybe we were wildly overconfident. If we got 30 maybe we were very underconfident.
Now we can’t compare climate models outputs of the future vs observations because the future hasn’t happened yet - there’s only one planet and climate forecasts are over decades to a century, not one week.
We can, however, compare the spatial variation of models with reality.
The text in papers may be a little incomprehensible to the casual reader. But I explain afterwards.
An extract from the paper:
In contrast to weather and seasonal forecasts, there is no set of hindcasts to ascertain the reliability of past climate trends per region. We therefore perform the verification study spatially, comparing the forecast and observed trends over the Earth. Climate change is now so strong that the effects can be observed locally in many regions of the world, making a verification study on the trends feasible. Spatial reliability does not imply temporal reliability, but unreliability does imply that at least in some areas the forecasts are unreliable in time as well. In the remainder of this letter we use the word ‘reliability’ to indicate spatial reliability.
This problem was approached in a similar way in two previous studies. Raisanen (2007) showed a global comparison of modelled linear trends (1955–2005) in temperature and precipitation over land in the CMIP3 multi-model ensemble to observed trends. Considering the frequency of cases in which the verification fell outside the forecast distribution, he found that only the temperature trends were compatible with the ensemble spread, precipitation trends were not..
.. Our analysis differs in that we use the more recent CMIP5 ensemble and include the years up to 2011. We also use a different trend definition to improve the signal/noise ratio. In addition, we employ a definition that factors out the global mean climate response to isolate the pattern of climate change that multiplies the global mean temperature change. This addresses the more stringent test whether the regional temperature trends are reliable relative to the global mean temperature trend.
[Emphasis added].
Here’s part of their first important graphic. Top left is “reality” or observations - trends over 60 years of temperature. This is what we’ve measured. Top right is observations of rainfall trends over the same time period (note that white means we don’t have reliable data, so it’s left out):

The middle row is the mean of the models simulating temperature and rainfall over the same time period. Not so important because we are most interested in the range.
The bottom row says “where does the observation at this grid point sit among all the models?”.
For example, if you look at the bottom left map you can see purple in some parts of the Pacific Ocean. This means that these squares are in the bottom 1% of the model outputs. And where you see bright red, that means the observations are in the top 1% of the model results.
Now, if climate models are doing a good job of simulating internal variability then you will have roughly 1% of the grid points being in the bottom 1% of the model results. And roughly 10% of the grid points being in the bottom 10% of the model results. And so on.
If that doesn’t make sense, please ask. There’s a familiarity that comes with thinking about these ideas over a period of time. It’s not immediately intuitive.
Now their last graphic from this figure makes it easier to see how well this is done. Focus on the red line, left is temperature, right is rainfall:

The bottom 16% of temperature observations sit in the bottom 10% of the model results. That’s not too far out. In a perfect world we might expect 10% (but we wouldn’t expect 10.00%, instead there’s some reasonable range that a stats person might come up with).
For rainfall, 17% of observations sit in the bottom 10% of model results, 15% in the top 10% of model results. Again, not too bad.
Things are looking good.
But Now for the Main Dish
As an editorial note, I’m often amazed at so many commenters on the old blog and in other climate blogs being certain that climate scientists are all eagerly trying to reinforce each others’ results, leaning in only one direction. That is true in press releases. But (overall) in papers, there is a hunt for scientific reality.
Van Oldenborgh and his colleagues point out a problem with the happy story above.
Climate models have a wide range of global mean temperature projections of the future and of the past. So the range of projections of climate models in any given location is wide.
Therefore, it’s easy to find observations fitting comfortably into this range. I’m paraphrasing - their text is below in the Notes section.
Imagine that models ranged from a global mean temperature rise of 0.1°C to 10°C over the last 100 years. (They don’t, this is to make a point). The actual observed global temperature rise is 1.1°C. If we looked at the temperature rise in a given location we would find that it was nicely fitting inside the “range of model projections”. But only because there was a ridiculously wide range of model results.
So what they did instead was normalize each model. They divided the temperature output in each grid square by the model’s global temperature response. And now they compared the actual observational results (divided by the observed global temperature change) with these “normalized” model results.
Here’s their revised graphics - only the bottom two rows change:
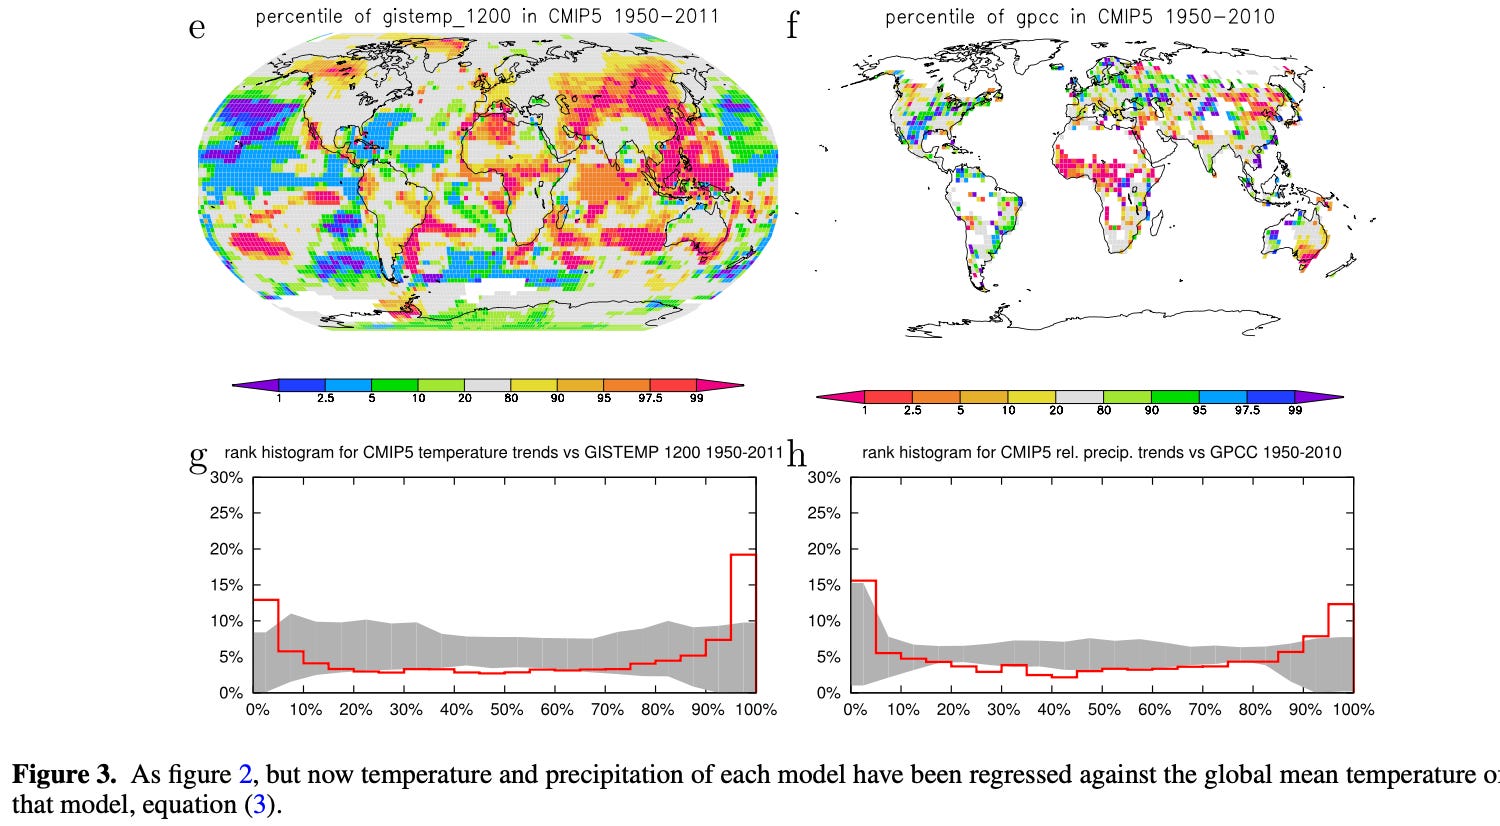
Now we see that about 19% of observations of temperature are in the bottom 10% of the model results. We would expect about 10%. And 27% are in the top 10% of the model results. We would again expect about 10%.
So the model is over-confident.
For rainfall it’s a similar story.
They conclude:
We investigated the reliability of trends in the CMIP5 multi-model ensemble prepared for the IPCC AR5. In agreement with earlier studies using the older CMIP3 ensemble, the temperature trends are found to be locally reliable. However, this is due to the differing global mean climate response rather than a correct representation of the spatial variability of the climate change signal up to now: when normalized by the global mean temperature the ensemble is overconfident. This agrees with results of Sakaguchi et al (2012) that the spatial variability in the pattern of warming is too small. The precipitation trends are also overconfident. There are large areas where trends in both observational dataset are (almost) outside the CMIP5 ensemble, leading us to conclude that this is unlikely due to faulty observations.
For future improvements, the mechanisms behind the differing trends have to be identified in order to improve the climate models. For now, the overconfidence of the ensemble has to be taken into account when interpreting CMIP5 data as an estimate of a probability forecast.
So this is a useful paper to understand that climate models have some issues. And so questions about natural variability inferred from climate models may be suspect.
The bigger point the paper is making is that a range of outcomes from climate models shouldn’t be interpreted as a “probability of this happening”. Climate scientists writing about climate models frequently stress this point. Then everyone else in climate science mostly ignores it.
Notes
More from the paper:
The flatness of the temperature trend rank histogram confirms for the CMIP5 ensemble earlier findings that the temperature rank histograms are flat when taking the same reference for each model, equation 2. However, this does not mean that the ensemble is reliable. The map of figure 2(e) shows coherent spatial patterns that seem to point to physical processes rather than statistical fluctuations resulting from weather noise. This is supported by the observation that the climate models that agree with the relatively high trend in The Netherlands did so because of a high global climate response (section 3).
This becomes clear when considering the trend pattern B(x,y) relative to the modelled global mean temperature rather than the observed one (equation (3), figure 3). Using this measure the ensemble is no longer reliable. There are many more areas with very low and very high percentiles in figure 3 than expected by chance: the rank histogram of the observations is outside the 90% envelope spanned by the CMIP5 models. The reliability of the temperature trends in figure 2 is therefore due to the different climate responses of the global mean temperature in the models and not due to a correct simulation of the pattern of warming. For each point separately the models encompass the observations, but the width is large enough for the wrong reason.
[Emphasis added]
References
Reliability of regional climate model trends, GJ van Oldenborgh et al, Environ. Res. Lett. (2013)
It appears to me that the spatial patterns of the models aren't even close to the actual data. If any engineer was looking at a CFD model for example and saw these differences, they would pronounce the model rather useless.