
Natural Variability, Attribution and Climate Models #12
Overview of Chapter 3 of the IPCC 6th Assessment Report

The periodic IPCC assessment reports are generally good value for covering the state of climate science. I’m taking about “Working group 1 - the Physical Science Basis”, which in the case of the 6th assessment report (AR6) is 12 chapters.
They are quite boring compared with news headlines. Boring and dull is good if you want to find out about real climate.
If you prefer reading about the end of days then you’ll need to stick to press releases.
Here’s a quick summary of Chapter 3 - “Human Influence on the Climate System”. Chapter 3 naturally follows on from Chapter 2 - “Changing State of the Climate System”.

The start of the chapter covers the approach of formal attribution statistics. These statistics are somewhat contrived because we need to know natural climate variability. I covered these ideas and their problems in #5 through to #8.
However, the bulk of the chapter has a fairly sensible and easy to understand approach:
how well models reproduce current climatology
how well models reproduce recent trends
how well models reproduce the year to year, or decade to decade, variability
how well models reproduce the climate around the end of the last ice age
how models have progressed through the various generations, with CMIP6 being the most recent (CMIP is the “climate model intercomparison project”)
Here are some samples.
Temperature
Surface temperature change is the aspect of climate in which the climate research community has had most confidence over past IPCC assessment reports. This confidence comes from the availability of longer observational records compared to other indicators, a large response to anthropogenic forcing compared to variability in the global mean, and a strong theoretical understanding of the key thermodynamics driving its changes.
A common theme in each section is looking at specific areas where models struggle:
The fundamental causes of temperature biases remain elusive, with errors in clouds, ocean circulation, winds, and surface energy budget being frequently cited candidates. Increasing horizontal resolution shows promise for decreasing long-standing biases in surface temperature over large regions.
Here’s a graphic on temperature. It might look a little overwhelming but the top left is actual temperature as modeled - the average of all the current climate models - and top right is the error between the average of the models and observations:
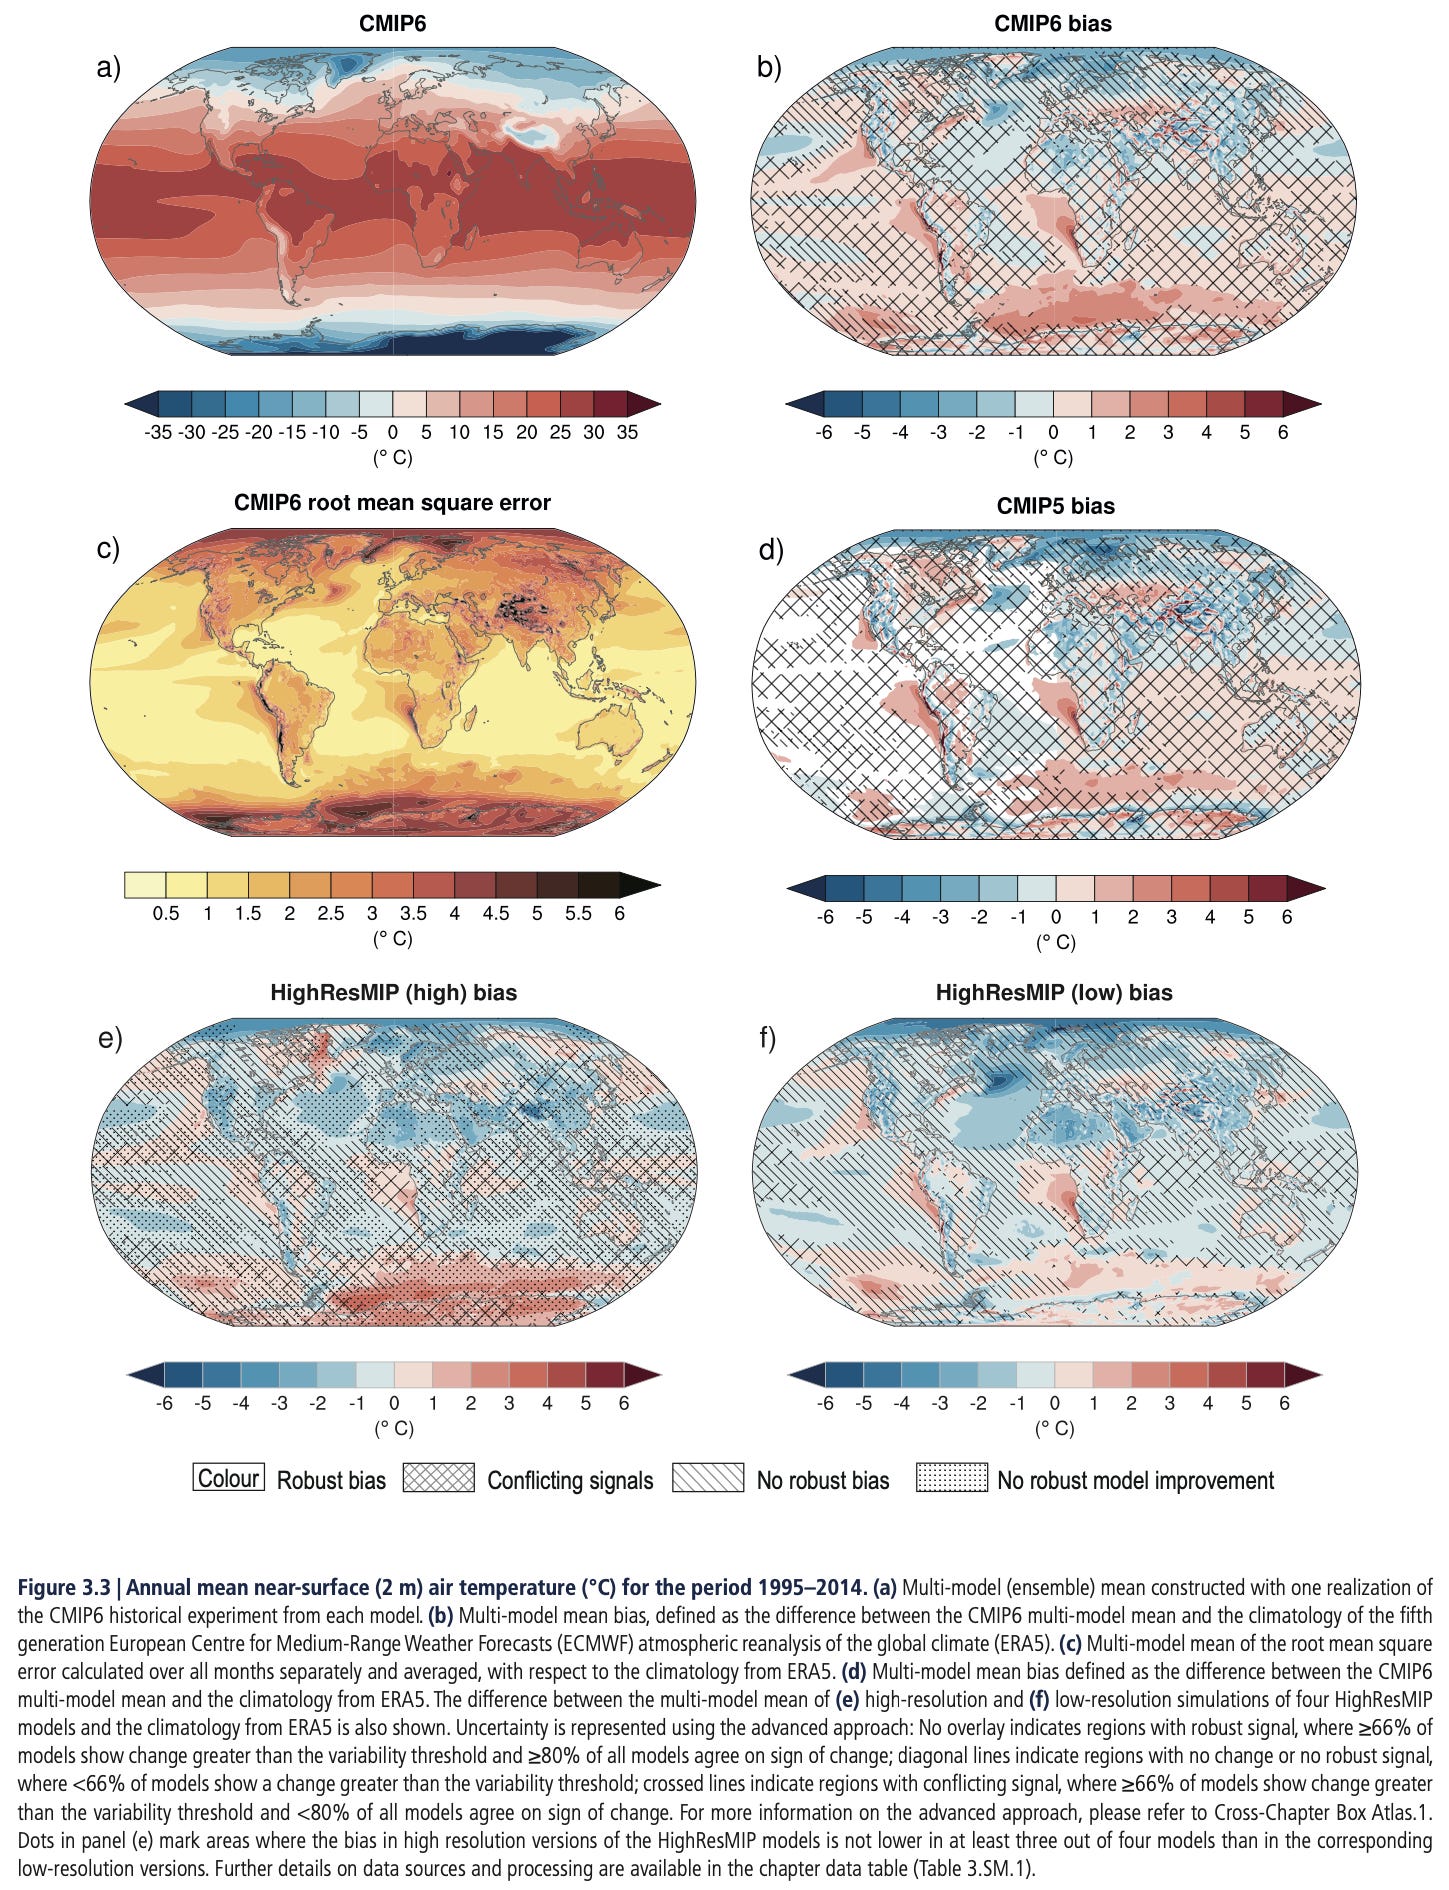
If you look at the middle right it shows the bias in the last generation of models (CMIP5) and you can compare it to CMIP6 and see that overall things haven’t changed that much, and have maybe gotten a little worse in some areas.
In summary, there is high confidence that CMIP6 models reproduce observed large-scale mean surface temperature patterns and internal variability as well as their CMIP5 predecessors, but with little evidence for reduced biases.
The report moves on to the air temperature in the lower atmosphere and notes:
Several studies since AR5 have continued to demonstrate an inconsistency between simulated and observed temperature trends in the tropical troposphere, with models simulating more warming than observations..
This problem persists and they detail the various attempts to resolve the problem.
Rainfall
A fact hindering detection and attribution studies in precipitation and other hydrological variables is the large internal variability of these fields relative to the anthropogenic signal.
Educational information lacking from press releases:
Furthermore, Williams et al. (2020) used a combination of hydrological modelling and tree-ring reconstructions to show that the period from 2000 to 2018 was the driest 19-year span in south- western North America since the late 1500s. Nonetheless, tree rings also indicate the presence of prolonged megadroughts in western North America throughout the last millennium that were more severe than 20th and 21st century events (high confidence). These were associated with internal variability and indicate that large-magnitude changes in the water cycle may occur irrespective of anthropogenic influence.
Current rainfall:
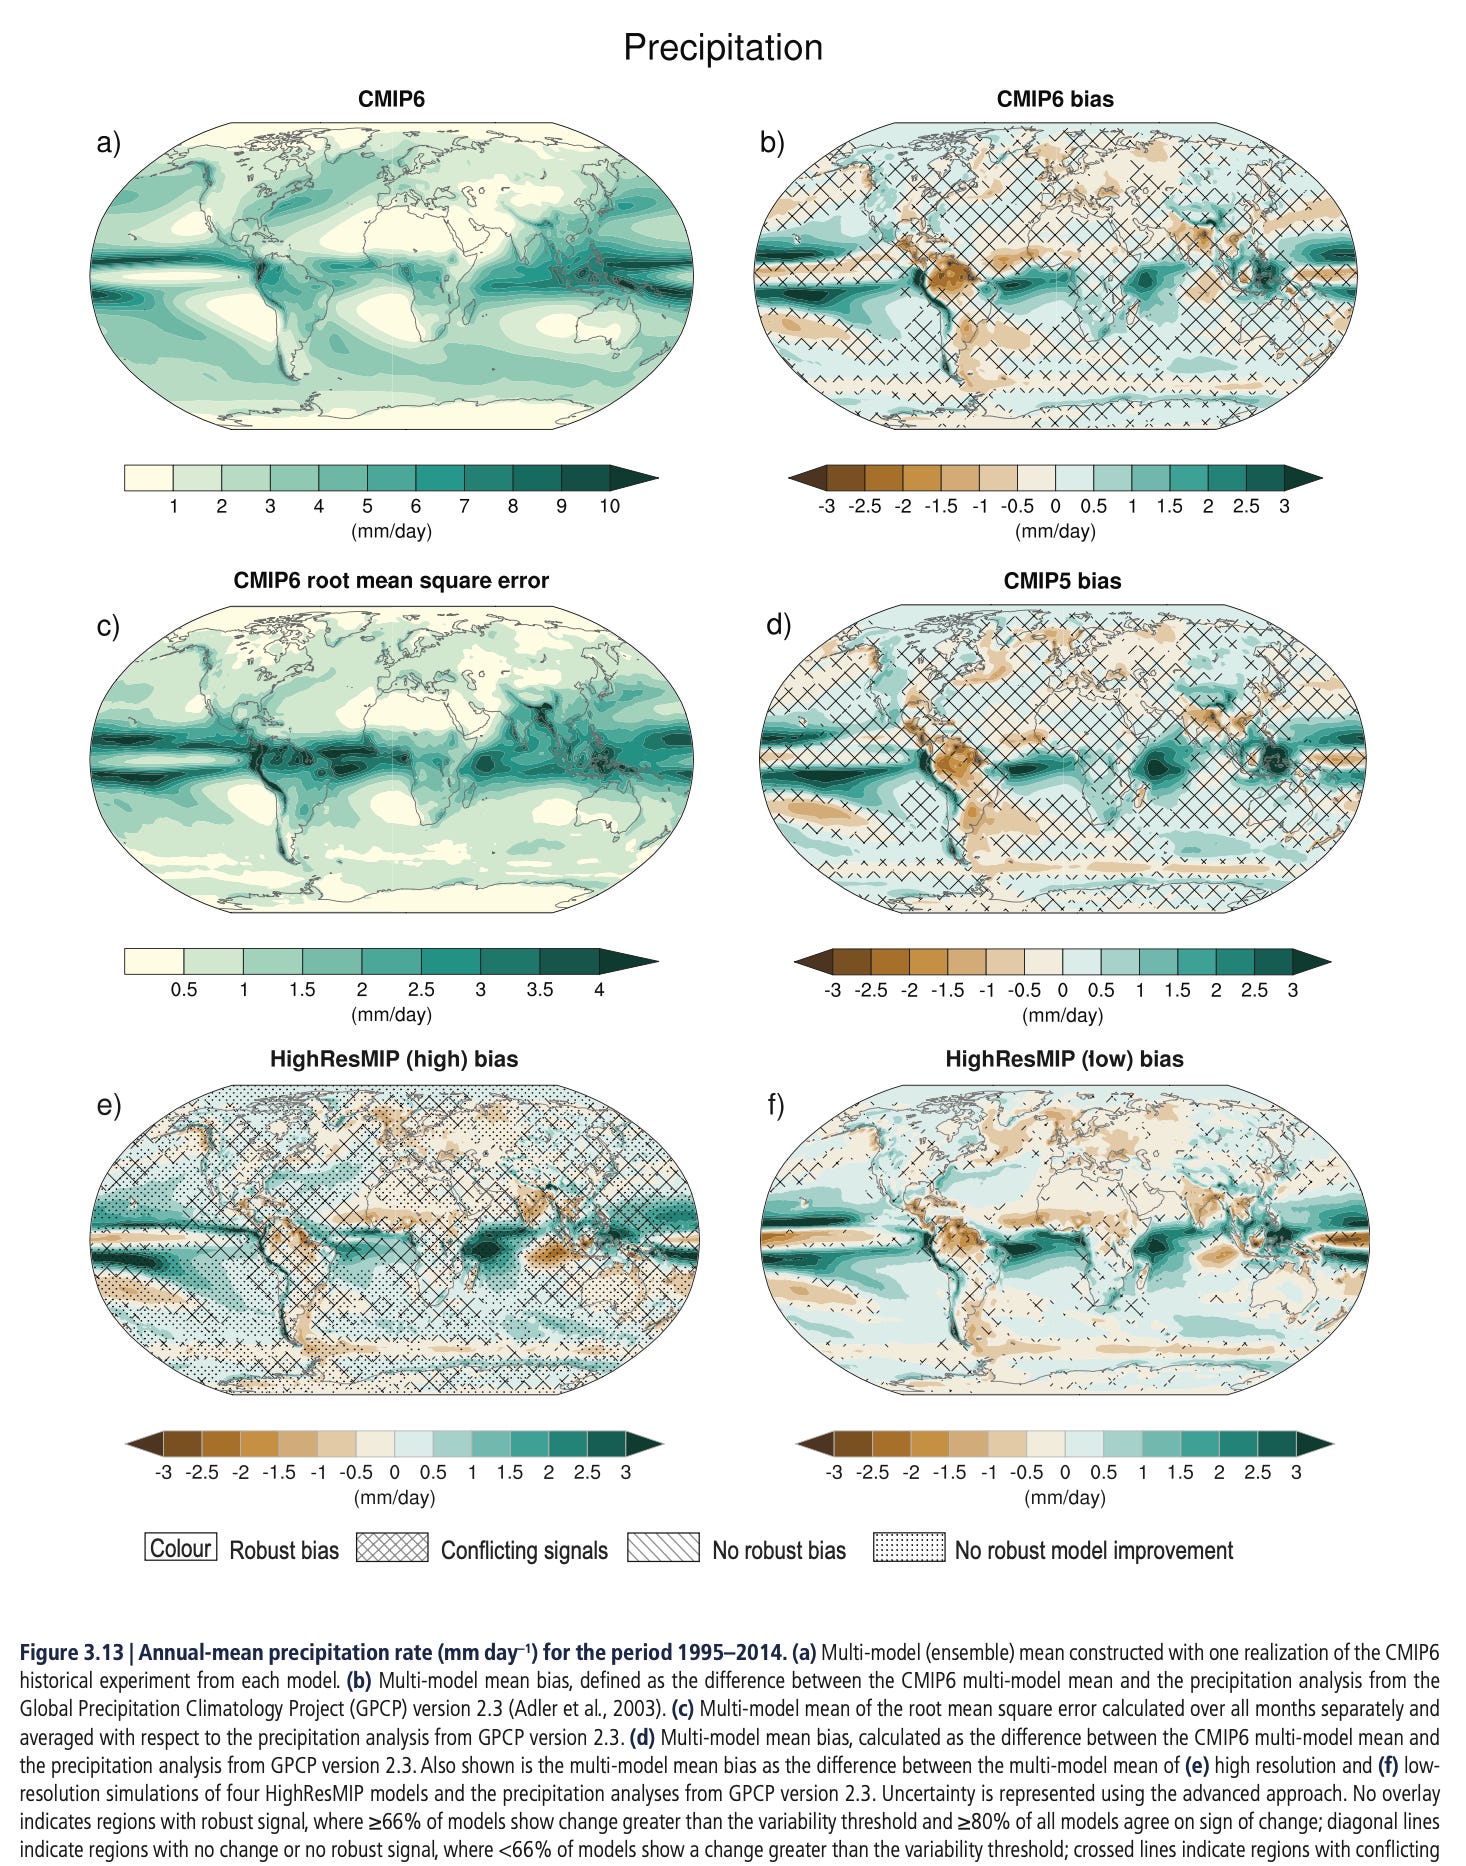
AR5 concluded that there was medium confidence that human influence had contributed to large-scale precipitation changes over land since 1950, including an increase in the Northern Hemisphere mid- to high latitudes. Moreover, AR5 concluded that observational uncertainties and challenges in precipitation modelling precluded a more confident assessment. Overall, it found that large-scale features of mean precipitation in CMIP5 models were in modest agreement with observations, but there were systematic errors in the tropics.
Here’s a graphic similar to the temperature graphic - top left is the average of all the current models (CMIP6), top right is the difference between models and observations, and middle right shows the same for the last generation of models (CMIP5):
Here’s a more useful graphic - change over time. We see two approaches to “reality” - GPCP and ERA5. For people new to climate it might be suprising to see that the black and gray lines are quite different. They are both attempts to understand reality.
Then we see the range of model results - blue and pink in the two graphics. The model range is so wide that observations (mostly) fit within the model results but that isn’t a strong endorsement of models ability to simulate rainfall changes over time.

Conclusion
For readers interested in specific areas of climate this chapter is well worth checking out. You will find good graphics, excellent summaries of how well models match observations, the problems in the observational record, good references to look up, what progress has been made in recent years, what problems remain, and so on.
References
To find the IPCC AR6 report, visit ipcc.ch. You need to navigate to “Working Group I” - https://www.ipcc.ch/report/ar6/wg1/ where you can scroll down to each chapter and download each one as you need. It’s the easiest way to read the actual report.
Eyring, V., N.P. Gillett, K.M. Achuta Rao, R. Barimalala, M. Barreiro Parrillo, N. Bellouin, C. Cassou, P.J. Durack, Y. Kosaka, S. McGregor, S. Min, O. Morgenstern, and Y. Sun, 2021: Human Influence on the Climate System. In Climate Change 2021: The Physical Science Basis. Contribution of Working Group I to the Sixth Assessment Report of the Intergovernmental Panel on Climate Change [Masson-Delmotte, V., P. Zhai, A. Pirani, S.L. Connors, C. Péan, S. Berger, N. Caud, Y. Chen, L. Goldfarb, M.I. Gomis, M. Huang, K. Leitzell, E. Lonnoy, J.B.R. Matthews, T.K. Maycock, T. Waterfield, O. Yelekçi, R. Yu, and B. Zhou (eds.)]. Cambridge University Press, Cambridge, United Kingdom and New York, NY, USA, pp. 423–552
Gulev, S.K., P.W. Thorne, J. Ahn, F.J. Dentener, C.M. Domingues, S. Gerland, D. Gong, D.S. Kaufman, H.C. Nnamchi, J. Quaas, J.A. Rivera, S. Sathyendranath, S.L. Smith, B. Trewin, K. von Schuckmann, and R.S. Vose, 2021: Changing State of the Climate System. In Climate Change 2021: The Physical Science Basis. Contribution of Working Group I to the Sixth Assessment Report of the Intergovernmental Panel on Climate Change [Masson-Delmotte, V., P. Zhai, A. Pirani, S.L. Connors, C. Péan, S. Berger, N. Caud, Y. Chen, L. Goldfarb, M.I. Gomis, M. Huang, K. Leitzell, E. Lonnoy, J.B.R. Matthews, T.K. Maycock, T. Waterfield, O. Yelekçi, R. Yu, and B. Zhou (eds.)]. Cambridge University Press, Cambridge, United Kingdom and New York, NY, USA, pp. 287–422
I need to add this ritual point to every single post:
Note for commenters - for those who don’t understand radiative physics but think they do and want to yet again derail comment threads with how adding CO2 to the atmosphere doesn’t change the surface temperature.. head over to "Digression #3 - The "Greenhouse effect" - https://scienceofdoom.substack.com/p/digression-3-the-greenhouse-effect/ - and add your comments there. Comments here on that point will be deleted.